Google statistics 2026: the data defining your growth
Alphabet's 2025 revenue: $402.8B (10-K, Feb 2026). Search $224.5B, Cloud $58.7B (+36%), YouTube $60B+. The figures that matter for AU businesses in 2026.
Alphabet’s full-year 2025 results, filed with the SEC on February 4 2026, put total revenues at $402.8 billion. That is the first time annual revenues have crossed $400 billion.
The Search engine that started it all generated $224.5 billion of that revenue. Google Cloud, the second engine, hit $58.7 billion (+36% YoY) and ended 2025 at a $70 billion+ annual run rate. YouTube, ads and subscriptions combined, exceeded $60 billion for the year.
Google still owns around 88% of Australian search (Statcounter, 2026) and about 90% globally. The Gemini App alone has grown to 750 million monthly active users. AI is now central to the model, not adjacent to it.
This analysis pulls the numbers from Alphabet’s 10-K and Q4 2025 results, the latest Statcounter market-share data, and the Stanford 2026 AI Index. Every figure is verifiable.
- Google’s Footprint: The Ecosystem in One View
- Search and Browser Dominance: The Core of the Empire
- The Mobile and Media Fronts: Android, iOS, and YouTube
- The Business Engines: Ads, Local Discovery, and Cloud
- The Next Chapter: AI, Australia Focus, and Our Data
Google’s Footprint: The Ecosystem in One View
The financial engine: where the money comes from in 2025
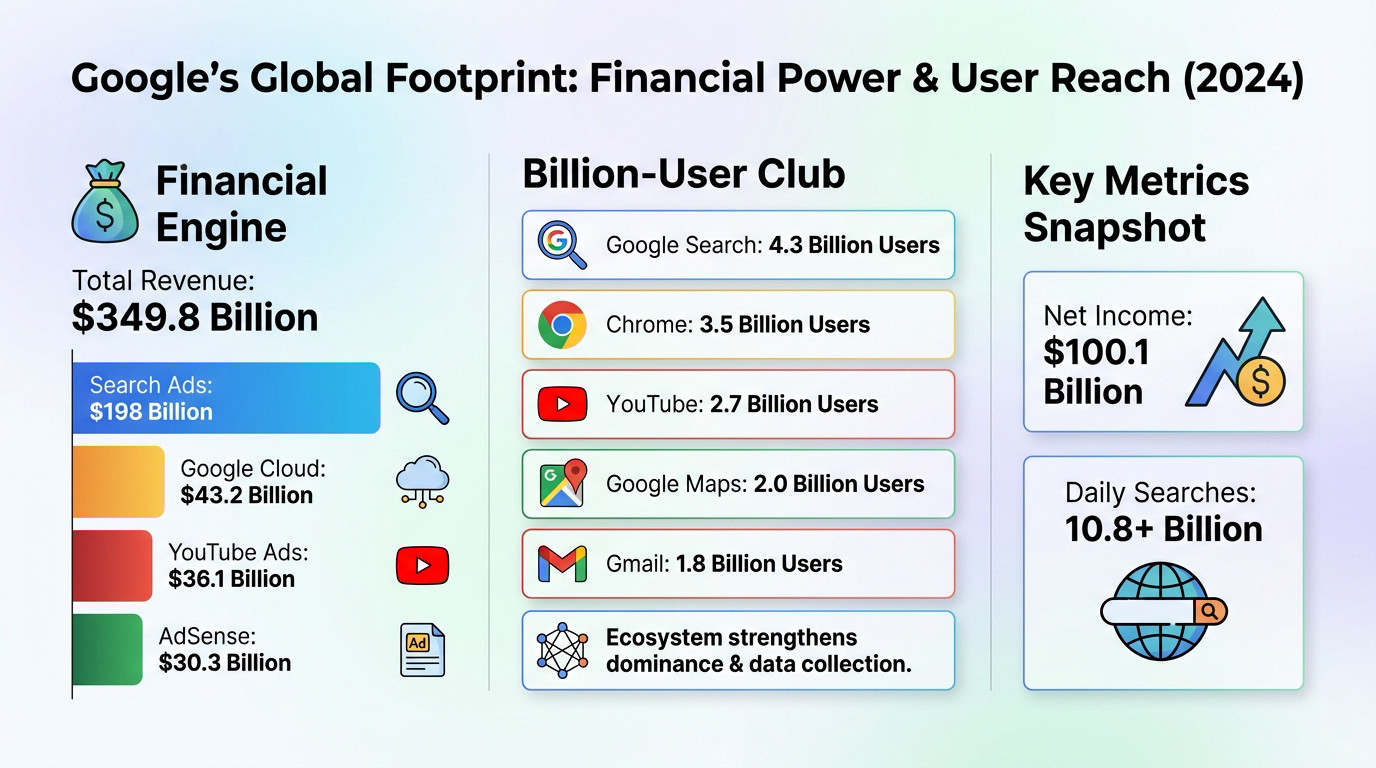
Alphabet’s full-year 2025 revenue hit $402.8 billion, up from $350.0 billion in 2024 (+15%). Net income climbed to $132.2 billion from $100.1 billion the year prior.
The revenue mix is shifting. Advertising still pays the majority of the bills, but Cloud is closing the gap fast.
- Google Search & other ads: $224.5 billion (+13% YoY)
- YouTube ads: $40.4 billion (+12% YoY)
- Google Network (AdSense-style): $29.8 billion (slight decline)
- Google subscriptions, platforms and devices: $48.0 billion (+19% YoY)
- Google Cloud: $58.7 billion (+36% YoY), annual run rate exceeded $70 billion by Q4 2025
- YouTube total (ads + subscriptions): exceeded $60 billion for the full year 2025
The billion-user club: Google’s product reach
The user numbers stay at unprecedented scale: at Google I/O 2026 the company said five products each pass 3 billion monthly users, Search, Android, Chrome, Gmail and YouTube, with Maps in the billion-plus tier. Google does not publish exact per-product counts. Gemini App: 750 million monthly active users, a Q4 2025 milestone Sundar Pichai called out in the earnings call.
Search volume itself is not something Google discloses cleanly. The most-cited independent estimate puts it at roughly 8.5 billion searches a day (Internet Live Stats), which works out to about 99,000 every second. Treat that one as an outside estimate rather than a filed figure, unlike the revenue numbers above.
The new context: 325 million paid subscriptions across consumer services (YouTube Premium, Google One, NFL Sunday Ticket, etc.). Google is no longer just an ad business.
From a Stanford dorm room to $400 billion: the timeline
For all the 2026 numbers, the company is only in its late twenties. Google was founded on 4 September 1998 by Larry Page and Sergey Brin, went public on 19 August 2004, and reorganised under the Alphabet holding company on 2 October 2015. FY2025 is the year the whole thing first cleared $400 billion in annual revenue.
Google in 60 seconds: the 2026 snapshot
The figures that matter, pulled from Alphabet’s 10-K for FY2025 filed February 4 2026.
| Metric | Value (FY2025) | Source |
|---|---|---|
| Total revenue | $402.8 billion | Alphabet 10-K |
| Net income | $132.2 billion | Alphabet 10-K |
| Employees (Alphabet) | 190,820 | Alphabet 10-K |
| Google Search & other ads | $224.5 billion | Alphabet 10-K |
| YouTube ads | $40.4 billion | Alphabet 10-K |
| Google Cloud revenue | $58.7 billion (+36% YoY) | Alphabet 10-K |
| Google Cloud Q4 run rate | $70 billion+ | Sundar Pichai, Feb 2026 |
| YouTube total (ads + subs) | $60+ billion | Sundar Pichai, Feb 2026 |
| Gemini App MAU | 750 million | Sundar Pichai, Feb 2026 |
| Paid consumer subscriptions | 325 million | Sundar Pichai, Feb 2026 |
| 2025 CapEx | $150+ billion | Stanford 2026 AI Index |
Alphabet revenue by segment, 2023 to 2025
Cloud is the fastest-growing segment, accelerating from 31% YoY (2023-2024) to 36% YoY (2024-2025). Source: Alphabet 10-K (Feb 2026).
Search and Browser Dominance: The Core of the Empire
Now that the big picture is set, let’s look at how the historic heart of the empire, search, maintains its near-total dominance.
Google’s near-total hold on search
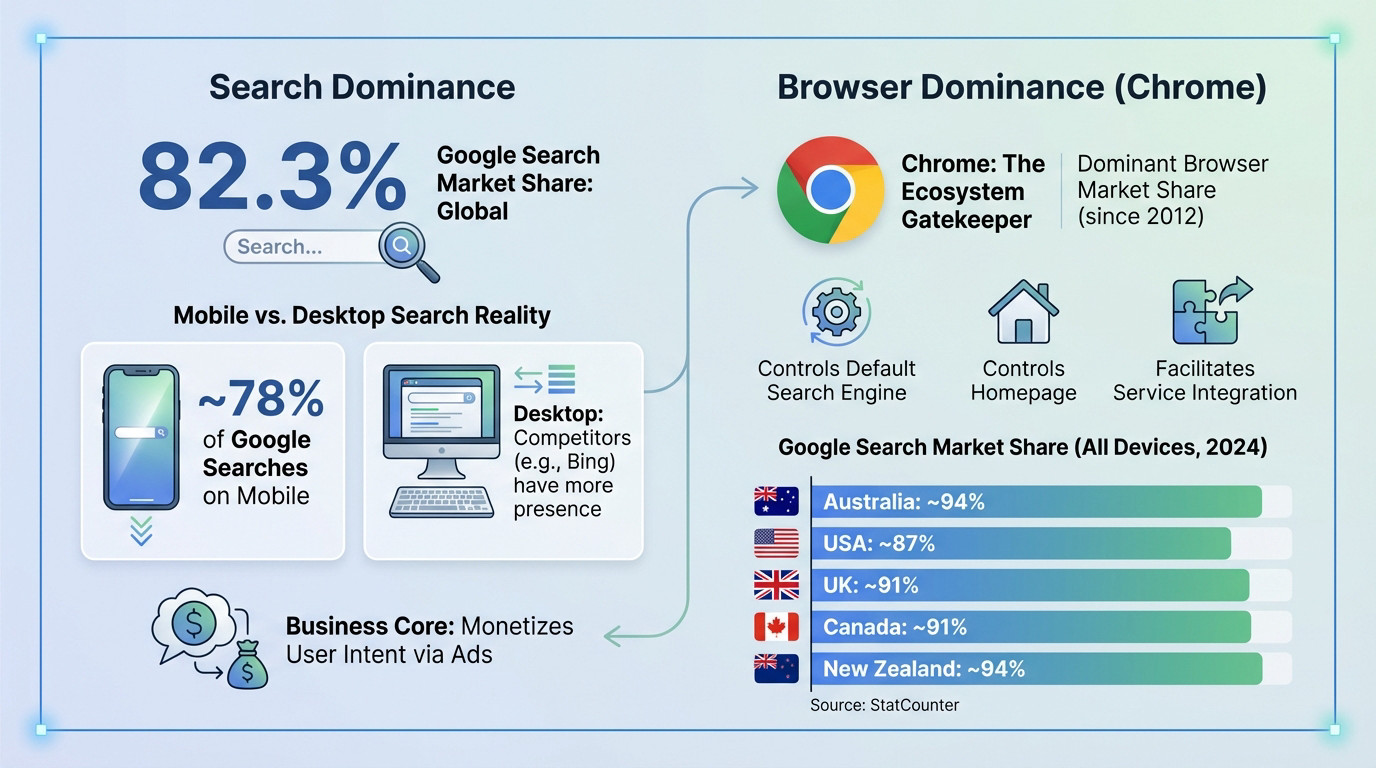
Google commands roughly 90% of global search market share (Statcounter, mid-2026), and about 88% in Australia (Statcounter, 2026). For AU-focused businesses, the practical takeaway is unchanged: optimising for anything other than Google is a secondary investment, not a primary one.
Google’s grip on Australian search remains near-total. Bing has actually ticked up to around 9% on the back of Copilot and Edge defaults, but that is off a tiny base and Google still handles the overwhelming majority of AU searches.
Desktop vs. mobile
Mobile is now the majority of online time in Australia (51.3% per ROI.com.au, January 2026). The share of search queries on mobile sits at roughly 60% (Statcounter device data), although Google itself does not publish a clean public number for this.
On desktop, Bing’s share is higher than on mobile, mostly because Bing ships as the default search engine on Edge in Windows, and corporate users rarely change defaults.
Chrome: the distribution layer
Chrome’s combined desktop + mobile share by country (Statcounter, late 2025):
- Australia: ~94%
- New Zealand: ~94%
- United Kingdom: ~91%
- Canada: ~91%
- United States: ~87%
Owning the default browser plus the default search engine in that browser gives Google a structural advantage no other platform has. Anything that wants to compete in search has to either win on quality (DuckDuckGo, Brave) or piggyback on a different surface entirely (ChatGPT, Perplexity). Brave has taken a third route, licensing its index to AI tools, and we looked at how Brave Search fits into AI answers.
The Mobile and Media Fronts: Android, iOS, and YouTube
Beyond the browser, the battle for dominance plays out in our pockets and across our screens through mobile operating systems and content platforms.
The mobile OS split in Australia
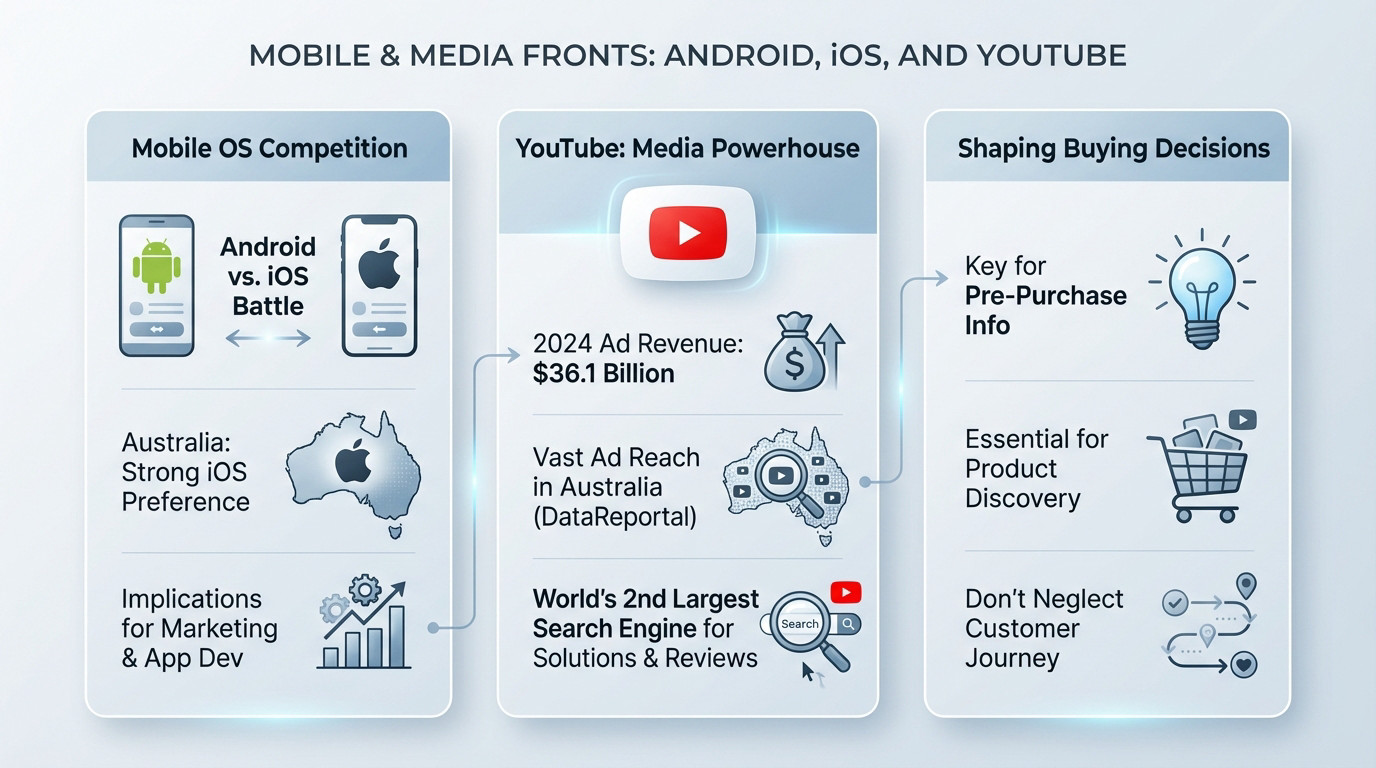
The AU mobile market is one of the most Apple-leaning in the world. iOS sits at roughly 55-59% of mobile web traffic (the exact number depends on the measurement source), with Android at roughly 40-45%.
Globally the split runs the other way. Android holds roughly 70% of the mobile operating system market (Statcounter) and iOS sits near 28%, so Australia is close to the mirror image of the worldwide norm. That is exactly why a global benchmark misleads here.
That ratio matters for budget allocation. AU campaigns that target only Android (cheaper development, broader global reach) miss more than half the addressable market locally.
YouTube’s media position
YouTube ads generated $40.4 billion in FY2025 (Alphabet 10-K), up from $36.1B in 2024. Adding YouTube Premium and YouTube TV subscriptions, the total exceeded $60 billion for the year, putting YouTube alone larger than several Fortune 100 companies.
For AU businesses, YouTube is functionally a search engine. Australians actively vet products, services and contractors via video before buying.
For e-commerce and service brands, ranking in YouTube search and the recommended-video feed often drives more qualified intent than a Google text result. The cost of producing decent video has dropped (smartphone footage, AI editing tools), so the production excuse no longer holds.
The Business Engines: Ads, Local Discovery, and Cloud
Understanding the ecosystem is one thing. Knowing how it generates revenue and how businesses can use it to find customers is another.
The economics of Google Ads
Google Search ads generated $224.5 billion in 2025, roughly 56% of Alphabet’s total revenue (Alphabet 10-K). YouTube ads added another $40.4 billion. The advertising machine is still the heart of the business.
The model is durable because it monetises pure intent. You pay to appear at the exact moment a customer types a query expressing a need. That precision makes it more recession-resistant than display or brand advertising, and explains why Search ad revenue grew 13% YoY even in a slowing global ad market.
A poorly managed Google Ads account routinely loses more in mismatched search terms and broad-match expansion than it gains in conversions. Real ROI comes from campaign management targeting profit, not clicks.
Local search and Google Maps: where local businesses are won
For service businesses (plumbers, lawyers, clinics, contractors), the real battle is local. Google Maps is the dominant global mapping app, and Google’s Local Pack is the primary surface where suburb-level intent meets supply. It is exactly why our law firm SEO work puts the Local Pack first.
A well-managed Google Business Profile is what gets a business into the “3-pack” of map results, and the 3-pack is what turns search into actual phone calls. Without it, you do not exist to a customer searching “plumber Subiaco” on their phone.
Google Cloud: the second engine
The Cloud line item is now too big to treat as a footnote. $58.7 billion in FY2025, up 36% YoY, with the Q4 2025 run rate exceeding $70 billion annually.
Cloud growth actually accelerated, from 31% YoY (2023→2024) to 36% YoY (2024→2025). It is driven almost entirely by enterprise AI infrastructure demand.
The main drivers per the 10-K:
- AI infrastructure (GPU/TPU capacity, model serving)
- Core Google Cloud Platform services (compute, storage, networking)
- Data analytics and database solutions
- Workspace and other enterprise apps
Google’s 2025 CapEx exceeded $150 billion (Stanford 2026 AI Index), most of it going to AI data center buildout. That is the production capacity powering Cloud’s continued growth.
The Next Chapter: AI, Australia Focus, and Our Data
Google’s foundations are solid, yet the future is already being redrawn by AI, while presenting distinct behaviors in markets like Australia.
Gemini 3, AI Overviews and the future of clicks
The biggest single 2025 Q4 milestone was the Gemini 3 launch. Sundar Pichai called it a “major milestone” on the Feb 2026 earnings call, and the numbers back it up:
- Gemini App: 750 million monthly active users
- Gemini API processes 10 billion tokens per minute in production
- AI Overviews now appear on roughly 16% of all Google search queries (per Semrush tracking) and on 64% of Australian users’ search sessions in any given month (ROI.com.au, January 2026)
The Search disruption is real. Google now answers many queries directly on the SERP, which inevitably reduces click-through to organic results. Pew Research data shows clicks drop from roughly 15% on AI Overview-free SERPs to about 8% when AI Overviews appear.
But the picture is more nuanced than “Google killed organic traffic”. AI Overviews are heavily concentrated in informational queries; high-intent commercial and local searches (the queries that actually convert) still send users to organic results and the Local Pack.
The adaptation: build content that gets cited by AI Overviews rather than competing against them, and double down on the surfaces (Google Business Profile, reviews, schema) that feed both organic and AI search. Our AI search engine optimisation work is built around exactly this shift.
What this actually means for Australian businesses
Global averages will steer you wrong here. Australia is one of the most Apple-leaning, Google-dominated markets on earth, and a US or UK benchmark misses both facts at once. When we set targets on our own AU client accounts, the local numbers are the ones that decide the budget split before a single campaign goes live: around 88% Google search share, an iOS-majority mobile base, and AI Overviews on a large share of monthly search sessions. They rarely match the worldwide figure the tools default to, and the gap is not small enough to ignore.
That difference between a global vanity metric and the number that moves revenue is the whole reason we track Australian data on its own line rather than borrowing the international average. It also feeds directly into how we read SEO and marketing trends in Australia.
How we compiled these numbers
Every figure here traces back to a primary filing or a named measurement source, not a chain of blogs quoting each other. Where a number is an outside estimate rather than a company disclosure, such as the searches-per-day figure, we say so in the line itself. The sourcing runs in four tiers:
- Tier 1: official Alphabet investor reports and SEC filings, which cover the revenue, net income and segment numbers.
- Tier 2: verifiable market-share data from StatCounter.
- Tier 3: platform reach data from reputable trackers such as DataReportal and Semrush.
- Tier 4: vetted industry research, including the Stanford AI Index.
We rebuild the page each time Alphabet files a new 10-K. This version was last updated on 23 July 2026; the underlying financials are sourced from the FY2025 10-K filed on 4 February 2026, which remains Alphabet’s most recent annual filing.
The dominance itself is not in question. What is changing is how people reach all of it: fewer plain blue links, more answers settled on the SERP, and a mobile, iOS-heavy, AI-Overview-heavy path to the same businesses that were already winning on Google a year ago. The Australian operators who adjust for that now, instead of defending a 2023 playbook, are the ones these numbers will keep rewarding.
FAQ
How much revenue did Alphabet generate in 2025?
Alphabet’s FY2025 total revenue was $402.8 billion (Alphabet 10-K, filed February 4 2026), up from $350.0 billion in 2024 (+15%). The biggest single contributor was Google Search & other ads at $224.5 billion.
Google Cloud hit $58.7 billion (+36% YoY), and YouTube total revenue (ads + subscriptions) exceeded $60 billion for the year. Net income was $132.2 billion.
What is Google’s search market share in Australia compared to the US?
Australia: around 88% combined desktop + mobile share (Statcounter, 2026). US: roughly 87%. Globally: about 90%.
For Australian businesses, Google is effectively the entire search market. Bing’s AU share has actually risen in 2026 (to around 9%, on Copilot and Edge defaults), but Google still handles the overwhelming majority of AU searches. That 9% is worth a specific pass rather than a rewrite, which is what Bing SEO and Copilot visibility covers.
How many people actually use Google products?
Google reports that five of its products, Search, Android, Chrome, Gmail and YouTube, each pass 3 billion monthly users, with Maps in the billion-plus tier (Google I/O 2026). Google does not publish exact per-product counts.
The newer number worth knowing: Gemini App has 750 million monthly active users (Sundar Pichai, February 2026).
Is Google Cloud still growing?
Yes, and the growth is accelerating. Cloud revenue grew 36% YoY in 2025 to $58.7 billion, up from 31% YoY growth in 2024. The Q4 2025 run rate exceeded $70 billion annually.
The growth is driven almost entirely by enterprise AI infrastructure demand. Google spent over $150 billion on CapEx in 2025, most of it on AI data center buildout to keep up.
What percentage of Google searches are on mobile?
Google does not publish a clean public number, but the broader Australian data shows mobile makes up 51.3% of online time (ROI.com.au, January 2026) and roughly 60% of search queries globally (Statcounter device data).
If your digital strategy prioritises desktop over mobile in 2026, you are effectively halving your reach. Mobile is where the volume and the high-intent action lives.
How many searches does Google handle a day?
Google does not publish an official daily search count. The most widely cited independent estimate is roughly 8.5 billion searches a day (Internet Live Stats), which is about 99,000 every second. It is an estimate rather than a filed figure, but it is the number most reference sources use.
For context, that scale is why even a fractional shift in AI Overview behaviour, a couple of percentage points of clicks moving off organic results, changes traffic for millions of businesses at once.