AI Statistics for 2026: Adoption, Jobs, Consumer Use, Trust and Regulation
AI statistics 2026 for Australia and globally: the ABS says 12% of AU businesses use AI, ADII 45.6% of Australians, plus Stanford AI Index investment, jobs and regulation data. Every figure sourced.
The headline: global corporate AI investment hit $581.7 billion in 2025, more than double the prior year. Organisational adoption is at 88%, generative AI deployment is at 70%, and one-third of organisations expect AI to reduce their workforce in the coming year.
The most consequential number is harder to digest. US software developer employment for the 22-25 age band has dropped nearly 20% since 2024, while older cohorts have grown. The disruption is targeted and just beginning.
This is the picture from the 2026 Stanford AI Index report released April 13 2026, the most comprehensive public accounting of where AI stands. Below is the data that matters for Australian businesses making AI decisions in the next 12 months: adoption, the local Australian numbers, jobs, spend, regulation, and what to do about it.
We run SEO for Australian businesses, and the pattern on the ground matches the data below: plenty of tools opened, very little actually in production. That gap between activity and real deployment is where the commercial advantage still sits in 2026.
- AI by the Numbers: Market Size and Headline Stats
- AI in Australia: The Local Numbers
- How Businesses Are Deploying AI: From Tools to Agents
- AI Adoption by Industry Sector
- The Impact on Jobs and People: Displacement, Skills, and the AI Divide
- AI Spend and Cost Statistics
- Trust, Regulation, and the Road to Responsible AI
AI by the Numbers: Market Size and Headline Stats
The headline numbers from the 2026 Stanford AI Index
The 2026 Stanford AI Index report, released April 13 2026, is the most comprehensive public accounting of where AI actually stands. The numbers are striking.
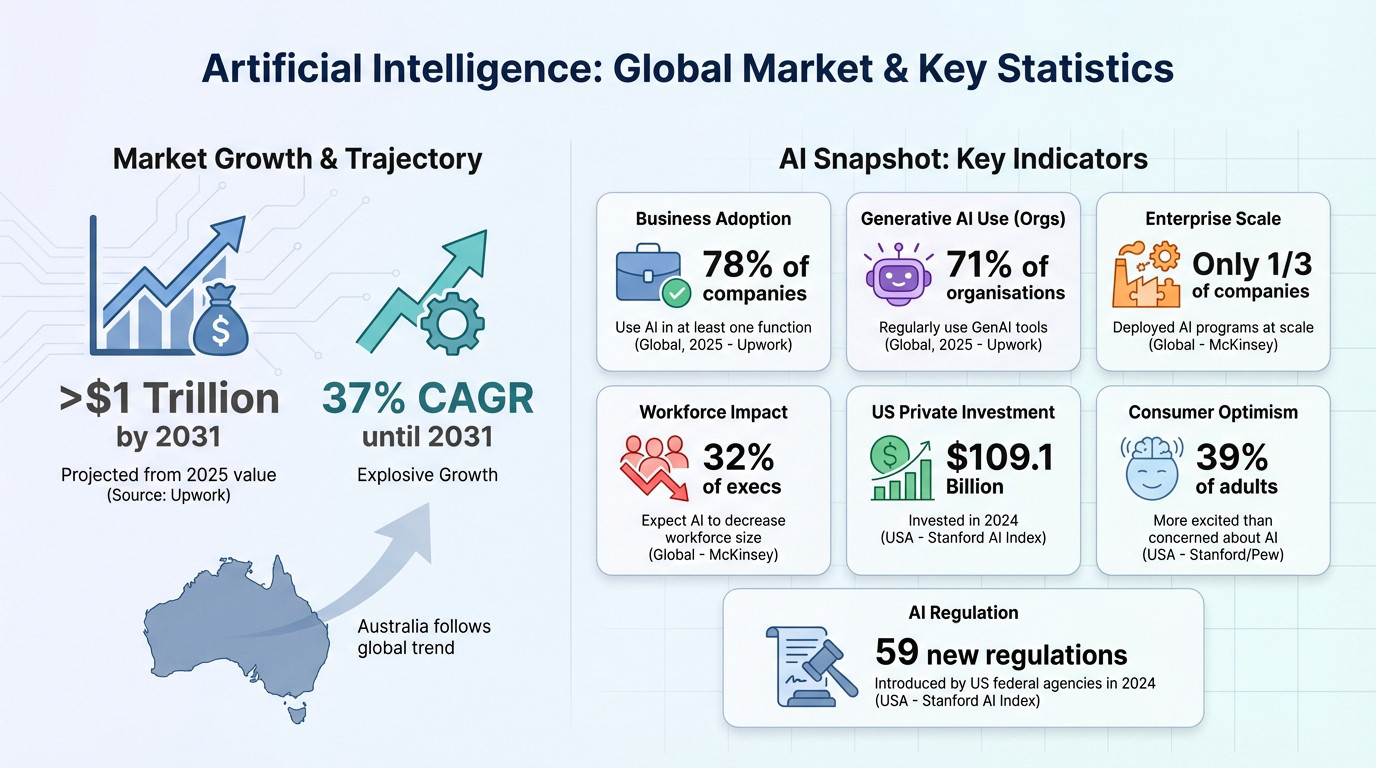
Global corporate AI investment hit $581.7 billion in 2025, up 130% from 2024. Private AI investment alone reached $344.7 billion, up 127.5% year-on-year.
The United States accounted for $285.9 billion of private investment in 2025, 23 times more than China’s $12.4 billion.
Generative AI is being adopted faster than any consumer technology in history. It reached 53% of the global population within three years of mass-market launch, faster than the personal computer or the internet ever did.
Australia’s local ecosystem follows the broader pattern. The Australian Digital Inclusion Index reports nearly half of Australians have recently used a generative AI tool, with adoption skewing young.
Global AI investment, 2023 to 2025
Corporate AI investment more than doubled in 2025, with private investment growing fastest at +127.5%. Source: Stanford 2026 AI Index.
AI snapshot: the indicators that matter in 2026
| Indicator | Data point | Geography | Source |
|---|---|---|---|
| Business adoption | 88% of organisations use AI in at least one business function | Global (2025) | Stanford AI Index 2026 |
| Generative AI deployment | 70% of organisations use generative AI in at least one business function | Global (2025) | Stanford AI Index 2026 |
| Private AI investment | $285.9 billion US in 2025, 23x China’s $12.4B | USA | Stanford AI Index 2026 |
| Global corporate AI investment | $581.7 billion in 2025, +130% YoY | Global | Stanford AI Index 2026 |
| Workforce expectations | One-third of organisations expect AI to reduce their workforce in the coming year | Global | Stanford AI Index 2026 |
| Entry-level displacement | US software developers aged 22-25: employment down ~20% since 2024 | USA | Stanford AI Index 2026 |
| Generative AI adoption | 53% of the global population in 3 years, faster than the PC or the internet | Global | Stanford AI Index 2026 |
| US adoption rank | US ranks 24th globally at 28.3% (Singapore 61%, UAE 54% lead) | Cross-country | Stanford AI Index 2026 |
| Global optimism | 59% of people say AI offers more benefits than drawbacks (up from 55% in 2024) | Global | Stanford AI Index 2026 |
| US consumer surplus | $172 billion annually from generative AI by early 2026 (up from $112B a year earlier) | USA | Stanford AI Index 2026 |
| Australian consumer use | 45.6% of Australians have recently used generative AI (2025) | Australia | Australian Digital Inclusion Index |
| AI incidents | 362 documented AI incidents in 2025, up from 233 in 2024 (+55% YoY) | Global | Stanford AI Index 2026 |
The composite picture: massive investment, historic-speed consumer adoption, real but uneven workforce displacement, and a measurement / governance layer that is falling further behind capability.
AI in Australia: The Local Numbers
Most AI statistics pages are US data with an Australian flag stuck on top. Here is what the actual Australian numbers say, and they disagree with each other in a way that matters for how you should act.
Counting conservatively, the Australian Bureau of Statistics puts business AI use at 12% in 2024-25. Industry surveys land three to four times higher: the National AI Centre recorded 43% of Australian SMEs reporting some AI adoption across the December 2025 to February 2026 quarter (44% in February), and AWS estimates roughly 1.3 million Australian businesses (50%) now use AI regularly.
The gap is not an error, it is a definition problem. The ABS counts AI embedded and in production. The vendor surveys count anyone experimenting with a chatbot. The honest read for an owner: genuine in-production adoption is still low, which means the competitive window is still open.
Australian business adoption
| Data point | Figure | Source |
|---|---|---|
| Businesses using AI, all sizes | 12% in 2024-25 | ABS 2024-25 |
| Large businesses | 35%, up from 9% in 2021-22 | ABS 2024-25 |
| Medium businesses | 22%, up from 3% in 2021-22 | ABS 2024-25 |
| Small and micro businesses | 11% | ABS 2024-25 |
| Information, media and telecommunications | 38%, the highest industry | ABS 2024-25 |
| Professional, scientific and technical services | 24% | ABS 2024-25 |
| Financial and insurance services | 24%, up from 1% in 2021-22 | ABS 2024-25 |
| SMEs reporting some AI adoption | 43% (Dec 2025 to Feb 2026 quarter; 44% in Feb) | National AI Centre 2026 |
| Businesses using AI regularly | 1.3 million (50%) | AWS 2025 |
The ABS figure is the one to trust for how many Australian businesses genuinely run AI. It also shows the real story is a size gap: a large business is three times more likely to use AI than a small one, 35% against 11%.
Australian consumer adoption
| Data point | Figure | Source |
|---|---|---|
| Australians who recently used a generative AI tool | 45.6% (2025) | Australian Digital Inclusion Index |
| Australians aged 18 to 34 | 69.1% | ADII 2025 |
| Australians aged 65 to 74 | 15.5% | ADII 2025 |
| Australians 14+ using AI in an average 4 weeks | 58%, about 13.6 million people (Mar quarter 2026) | Roy Morgan 2026 |
Adoption skews hard by age, 69.1% of under-35s against 15.5% of those aged 65 to 74. That is the AI divide in one line: the gap is generational before it is anything else, and it matches the pattern in our search engine usage statistics for Australia, where younger users move first.
What AI is worth to the Australian economy
The Tech Council of Australia and Microsoft projected generative AI could add between $45 billion and $115 billion a year to the Australian economy by 2030, with the $115 billion figure representing the fast-adoption scenario, not a flat estimate. The same work projected around 200,000 AI-related jobs in Australia by 2030.
Read these as the reachable local market, not a rounding error inside a global number. For a business in Perth or Sydney, the Australian figures are the ones you actually operate inside.
How businesses are deploying AI: from tools to agents
The headline numbers paint a confident picture. The deployment data shows a more nuanced story.
Widespread adoption, shallow deployment
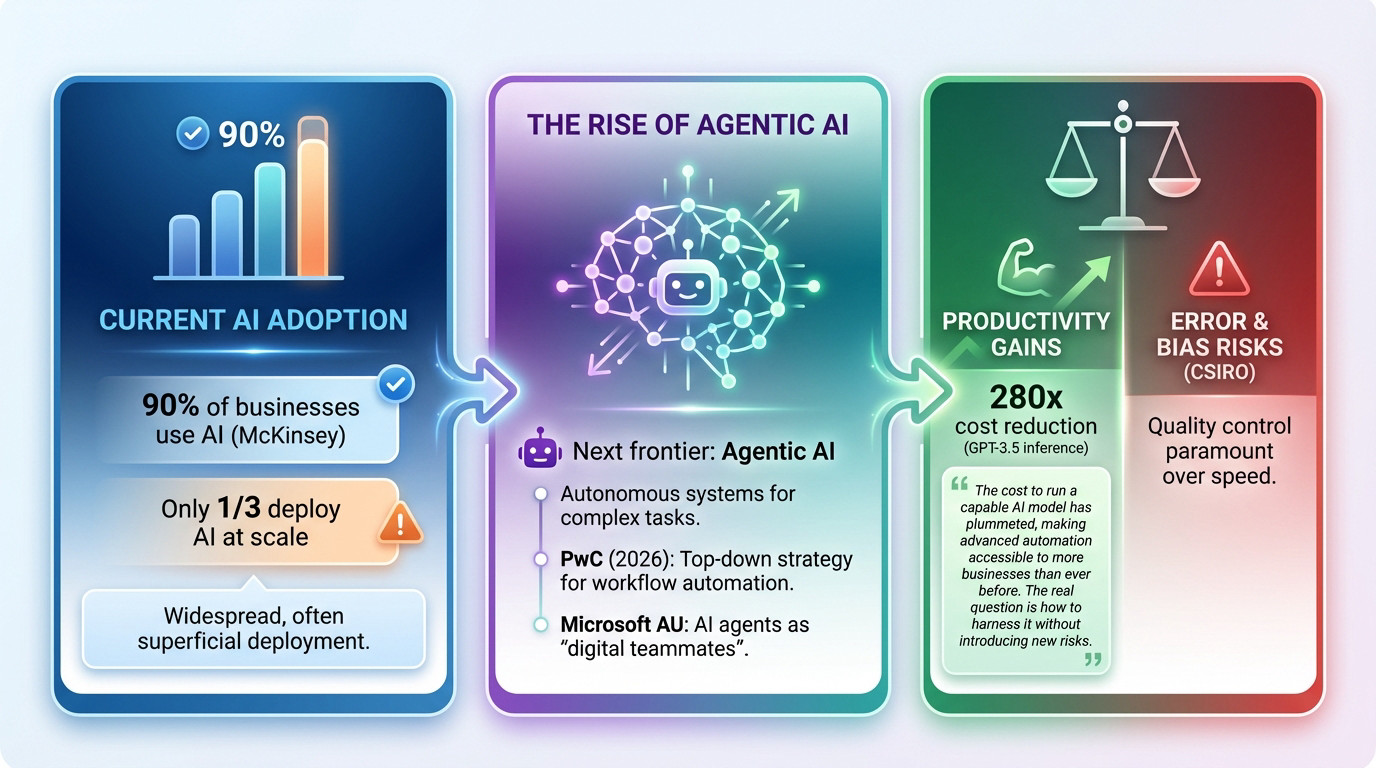
The 2026 Stanford AI Index puts organisational AI adoption at 88%, with 70% using generative AI in at least one business function. McKinsey’s State of AI 2025 survey lands close on the first number and higher on the second: 88% using AI, and 79% using generative AI, up from 71% in 2024 and just 33% in 2023. The estimates sit in a 70 to 79% band depending who is surveyed, so quote the source, not a single official figure.
The deployment depth is the catch. AI agent adoption (autonomous systems, not just chatbots) remains in the single digits across nearly every business function. Most organisations are still in the experimentation phase.
Real competitive advantage in 2026 will not come from adopting AI tools. It will come from being among the small fraction that integrates them deeply enough to produce measurable productivity gains.
The rise of agentic AI
Agentic AI is the next step beyond chatbots: autonomous systems that execute multi-step tasks without constant prompting. PwC’s AI predictions for 2026 frame these as “digital team members” rather than tools.
The Stanford 2026 Index confirms agent adoption is still early. Across nearly every business function, agent deployment sits in the single digits. The displacement and productivity numbers we see so far are happening before widespread agent rollout, not after it.
That timing matters for AU businesses: the curve from here is steeper, not flatter.
Productivity gains: where the data is strongest
Stanford 2026 documents productivity gains where AI has been deployed at scale:
- 14 to 15% gains in customer support
- 26% gains in software development
- Up to 72% gains in marketing output
The gains are largest in structured, measurable work where outputs are easy to monitor. Tasks requiring deeper reasoning show smaller or sometimes negative effects, and recent evidence raises concerns that heavy AI reliance may carry long-term learning penalties.
Inference costs have also plummeted (roughly 280x for GPT-3.5-class systems since 2022), which removes the cost barrier that used to limit deployment.
The race in 2026 is not about whether to deploy, it is about quality control on what you deploy. A sloppy implementation costs more in errors than it saves in efficiency.
AI Adoption by Industry Sector
Not every sector moves at the same pace, and the Australian data shows the spread clearly. From the ABS 2024-25 figures:
- Information, media and telecommunications: 38%, the highest of any industry
- Professional, scientific and technical services: 24%
- Financial and insurance services: 24%, up from just 1% in 2021-22
Financial and insurance services is the standout, growing its adoption roughly 24 times in three years off a tiny base. Globally, McKinsey’s State of AI 2025 confirms the cross-industry headline of 88% using AI and 79% using generative AI, though it does not publish clean per-sector percentages for 2025, so treat any older sector splits floating around online as out of date.
The lesson for a business owner is not to benchmark against the global average. It is to look at your own industry’s real adoption, then decide whether being early is an advantage worth taking in your market.
The Impact on Jobs and People: Displacement, Skills, and the AI Divide
This transformation of business processes hits people directly. Beyond the productivity graphs, here is what the 2026 data shows about workforce shifts and public adoption.
The displacement is targeted, and just beginning
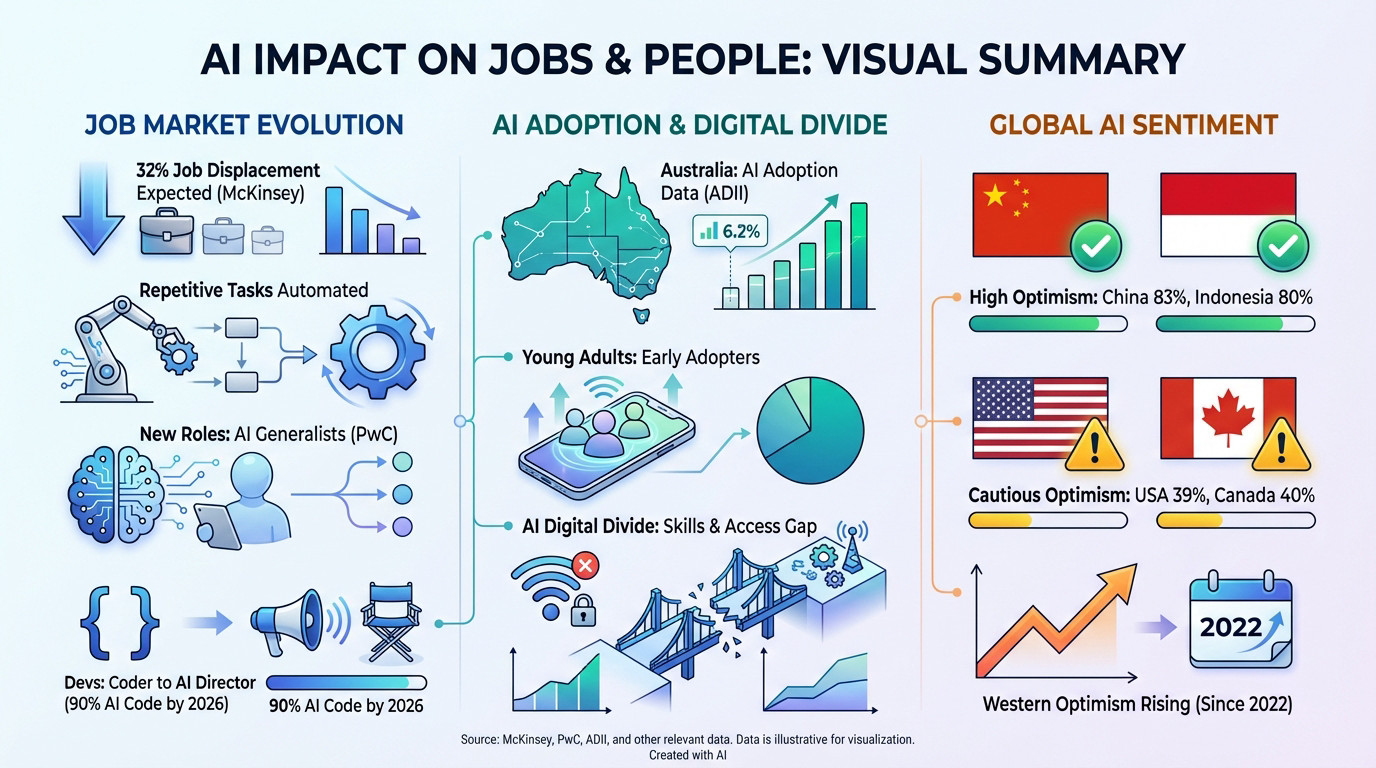
The clearest workforce signal in Stanford 2026 is concentrated, not broad. Employment among US software developers aged 22 to 25 has dropped nearly 20% since 2024, while their older colleagues’ headcount has grown.
The same pattern shows up in customer service. Older workers in the same roles have held steady; the entry-level cohort has been squeezed.
One-third of organisations surveyed expect AI to reduce their workforce in the coming year, with the highest anticipated reductions in software engineering, supply chain, and service operations. The displacement is highly targeted and, given how early agent adoption still is, only just beginning.
The global jobs picture, and where the value is moving
The World Economic Forum Future of Jobs 2025 projects 170 million new jobs created and 92 million displaced by 2030, a net gain of 78 million, with 22% of current jobs churned over the period. 86% of employers expect AI and information processing to transform their business by 2030.
The value is shifting to people who can work with the tools. PwC’s 2025 Global AI Jobs Barometer found jobs exposed to AI are growing 3.5 times faster than other roles, and workers with AI skills now command a 56% wage premium, double the 25% of a year earlier. New roles are forming on the other side of displacement: people who orchestrate AI agents rather than do the task by hand. The 2026 question is less whether AI takes your job and more whether you are a player or a coach.
Australia’s AI divide
As the Australian numbers above show, adoption skews strongly young: 69.1% of 18 to 34 year olds have used generative AI against 15.5% of those aged 65 to 74 (ADII 2025). That gap creates a real AI digital divide. Segments of the population without access or skills are not just lagging, they are being locked out of an increasingly AI-mediated economy.
Global consumer attitudes
Global optimism about AI rose from 55% in 2024 to 59% in 2025 (Stanford 2026), even as the share saying these products make them nervous edged up to 52%.
The country differences are sharp:
- Southeast Asia leads on optimism: Malaysia, Thailand, Indonesia and Singapore all over 80% expect AI to profoundly change their lives in the next 3 to 5 years.
- Workplace usage is highest in emerging economies: India, China, Nigeria, the UAE, Egypt and Saudi Arabia all report over 80% of employees using AI at work semi-regularly. The global average is 58%.
- US is the most wary on regulation: only 33% of Americans expect AI to make their jobs better (global average 40%), and just 31% trust their government to regulate AI, the lowest of any country surveyed. The EU is trusted more than either the US or China for AI regulation globally.
AI Spend and Cost Statistics
The money is moving in two directions at once: total spend is climbing while the cost per unit of AI collapses.
- Global corporate AI investment: $581.7 billion in 2025, up 130% (Stanford AI Index 2026)
- Global private AI investment: $344.7 billion in 2025 (Stanford AI Index 2026)
- Worldwide generative AI spending: $644 billion in 2025 (Gartner, March 2025)
- AI-supporting technology spend: $337 billion in 2025, forecast to pass $749 billion by 2028 (IDC)
- Inference cost for a GPT-3.5-class query: down roughly 280 times since 2022 (Stanford AI Index 2026)
The falling inference cost is the quiet story. The barrier to deploying AI is no longer the compute bill, it is judgement about where to point it.
Trust, Regulation, and the Road to Responsible AI
Regulation is tightening, and the measurement layer is falling behind
The Stanford 2026 Index records 362 documented AI incidents in 2025, up from 233 in 2024 (+55%). That is the practical evidence that the deployment is outpacing the safety work.
On the regulation side, GDPR remains the most-cited regulatory influence on responsible AI practice (60% in 2025, down from 65% in 2024), but new AI-specific frameworks are climbing fast. ISO/IEC 42001 (AI management system standard) is now cited by 36% of organisations, and the NIST AI Risk Management Framework by 33%. The share of organisations reporting “no regulatory influence at all” fell from 17% to 12%.
The most unsettling data point: the Foundation Model Transparency Index dropped from 58 in 2024 to 40 in 2025. Companies are getting less transparent about their models even as the models become more central to the economy.
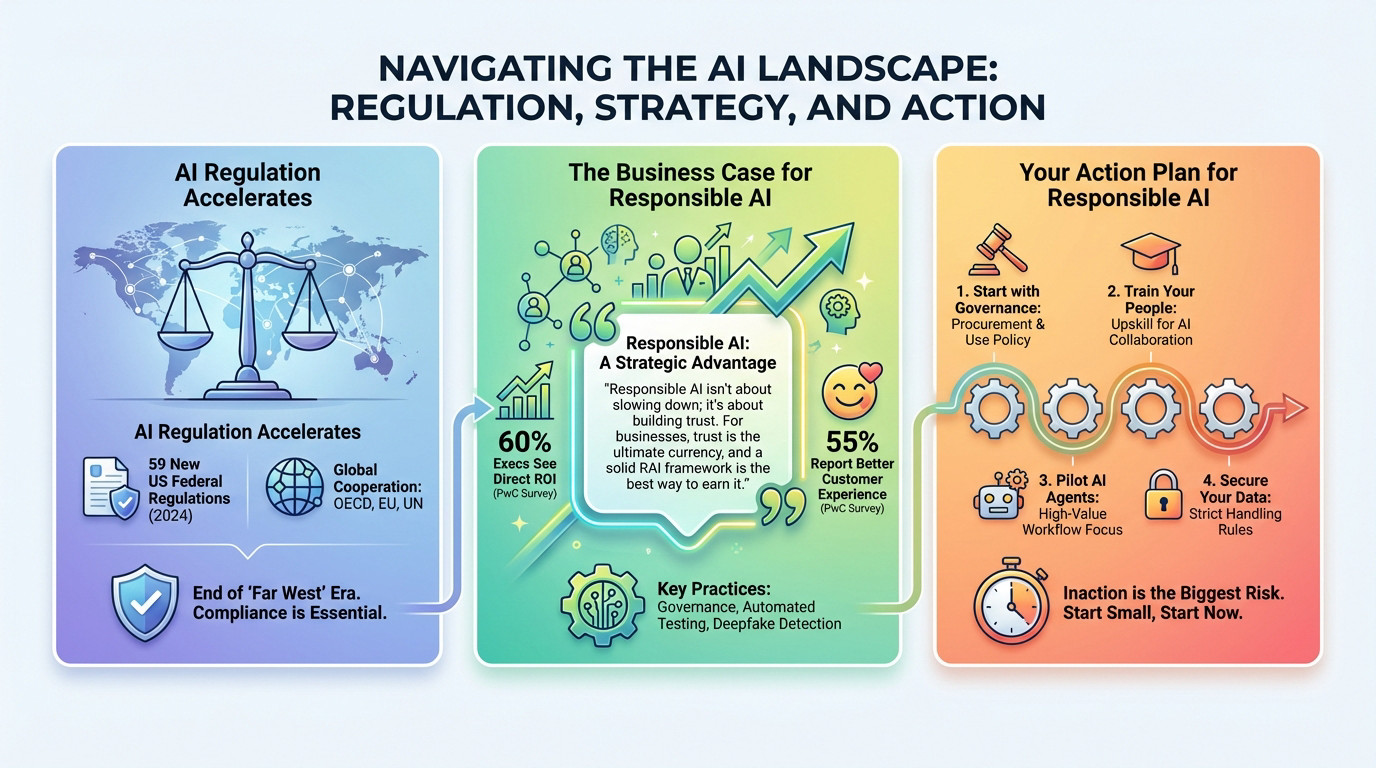
The business case for Responsible AI
Responsible AI (RAI) is now a procurement and competitive issue, not just a compliance one. The Stanford 2026 Index records that AI-specific governance roles grew 17% in 2025, and the share of businesses with no responsible AI policies in place fell sharply from 24% to 11%.
The remaining obstacles are practical: knowledge gaps (cited by 59% of organisations), budget constraints (48%), and regulatory uncertainty (41%). Most organisations want to do this work; they are not yet equipped to.
PwC’s data adds the commercial argument: roughly 60% of executives report direct ROI from RAI investment, and 55% cite improved customer experience. For a buyer evaluating you against a competitor, “we have automated testing, governance and an incident-response playbook” is increasingly a tiebreaker.
Practical takeaways for Australian businesses
Four things worth doing in the next quarter, in order:
- Set up the governance: an acceptable-use policy for AI tools, a procurement checklist, and a single owner accountable for AI decisions.
- Upskill the team: do not just deploy tools; budget actual time for staff to learn to work alongside them.
- Pilot one agentic workflow: identify one high-value, complex process and run an agentic AI pilot with a clear success metric. Aim small enough to ship in a quarter.
- Lock down the data: define what AI tools may access, what they may not, and where logs live. Data leaks via AI tools are now a documented incident category.
Sitting on the fence is the most expensive option in 2026. The Stanford data shows the gap between organisations that are scaling AI and those that are not is widening, not narrowing.
The stats paint a clear picture: AI is reshaping the basics of how AU businesses operate. Generative Engine Optimization (GEO) is now part of staying visible online, not a futurist’s bet. Start with one high-value pilot, secure your data, and move forward.
FAQ
How big is the AI market in 2025 and 2026?
Global corporate AI investment hit $581.7 billion in 2025, up 130% on 2024 (Stanford AI Index 2026). Private investment alone reached $344.7 billion. Worldwide generative AI spending was around $644 billion in 2025 (Gartner), and IDC forecasts AI-supporting technology spend to pass $749 billion by 2028.
How many Australian businesses use AI?
It depends who is counting. The ABS puts it at 12% of businesses in 2024-25, measuring AI that is genuinely in production. Industry surveys are higher: 43% of SMEs across the December 2025 to February 2026 quarter (National AI Centre) and 50% of businesses (AWS). The ABS figure is the conservative, most reliable one, and it shows a clear size gap: 35% of large businesses use AI against 11% of small and micro businesses.
How many Australians use AI tools?
Around 45.6% of Australians have recently used a generative AI tool (Australian Digital Inclusion Index, 2025), and Roy Morgan found 58%, about 13.6 million people aged 14 and over, used AI in an average four-week period in early 2026. Usage skews young: 69.1% of 18 to 34 year olds against 15.5% of those aged 65 to 74.
Will AI actually reduce the number of jobs available?
The displacement is real but targeted. US software developer employment for the 22 to 25 age band dropped nearly 20% since 2024, while older cohorts in the same role grew. The World Economic Forum projects a net gain of 78 million jobs globally by 2030 (170 million created, 92 million displaced), with 22% of jobs churned. The value is moving to people with AI skills, who now earn a 56% wage premium (PwC 2025).
How many companies have actually adopted AI?
88% of organisations use AI in at least one business function (Stanford AI Index 2026), and 70 to 79% use generative AI depending on the survey (Stanford, McKinsey State of AI 2025). The catch is depth: AI agent deployment remains in the single digits across nearly every business function. Most are still experimenting.
Is AI regulation increasing in Australia and globally?
Yes. GDPR remains the most-cited influence, but AI-specific frameworks like ISO/IEC 42001 (36% of organisations) and the NIST AI Risk Management Framework (33%) are climbing fast. Documented AI incidents rose 55% in a single year, from 233 to 362, and the share of organisations claiming no regulatory influence at all fell from 17% to 12%.
Sources
- Stanford HAI, 2026 AI Index Report: https://hai.stanford.edu/ai-index/2026-ai-index-report
- Australian Bureau of Statistics, Business Adoption of Artificial Intelligence 2024-25: https://www.abs.gov.au/media-centre/media-releases/business-adoption-artificial-intelligence-accelerates-2024-25
- Australian Digital Inclusion Index, The AI Divide in Australia: https://digitalinclusionindex.org.au/case-study-the-ai-divide-in-australia/
- Roy Morgan, AI Tools Usage March 2026: https://www.roymorgan.com/findings/10248-artificial-intelligence-ai-tools-usage-march-2026
- McKinsey, The State of AI 2025: https://www.mckinsey.com/capabilities/quantumblack/our-insights/the-state-of-ai
- PwC, 2025 Global AI Jobs Barometer: https://www.pwc.com/gx/en/services/ai/ai-jobs-barometer.html
- World Economic Forum, Future of Jobs Report 2025: https://www.weforum.org/publications/the-future-of-jobs-report-2025/
- Tech Council of Australia and Microsoft, Australia’s Generative AI Opportunity (2024): https://techcouncil.com.au/newsroom/ai-to-create-200000-jobs-in-australia-by-2030/
- Gartner, Worldwide GenAI Spending Forecast (March 2025): https://www.gartner.com/en/newsroom/press-releases/2025-03-31-gartner-forecasts-worldwide-genai-spending-to-reach-644-billion-in-2025
- IDC, FutureScape Worldwide IT Industry Predictions: https://my.idc.com/getdoc.jsp?containerId=prUS52691924
- AWS, Unlocking Australia’s AI Potential (2025): https://www.aboutamazon.com.au/news/aws/new-aws-research-shows-one-australian-business-adopts-ai-every-three-minutes