
What Is Geo-Grid Rank Tracking? A Plain-English Guide for Australian Businesses (2026)
Geo-grid rank tracking shows your true Google Maps ranking from every point in your area. Here's how it works, what it costs, and whether you need it.

Ask a Perth plumber where they rank on Google for “emergency plumber” and you’ll get one number. That number is almost always wrong. Not because the plumber is making it up. Because there is no single rank.
Search from their office on Hay Street and the result might be #1. Search from a customer’s kitchen in Joondalup and the same business is invisible. Same profile, same reviews, same keyword. Google ranks it differently from every place a searcher could stand.
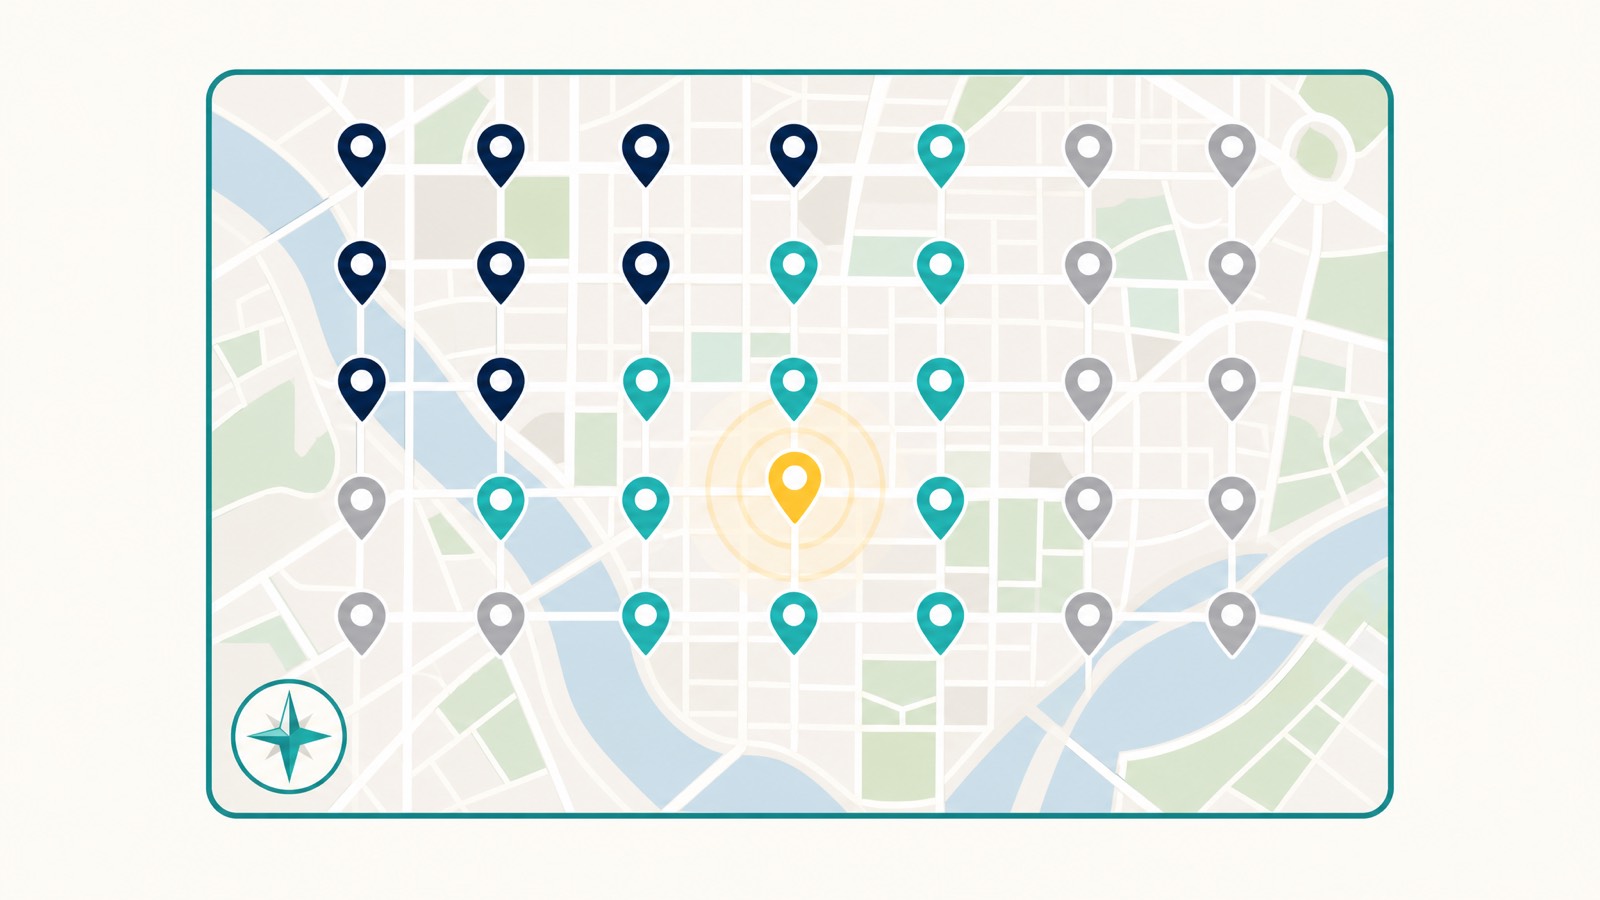
Geo-grid rank tracking is the only honest way to see that. It puts a virtual grid over your city, runs the same keyword from every point on the grid, and shows you the result as a colour-coded map. One scan, one keyword, dozens or hundreds of true ranks.
This guide covers what geo-grid rank tracking is, how the mechanic works, which tools do it, what they cost, and whether your business actually needs one.
- Geo-grid rank tracking checks your Google Maps and local pack ranking from many specific points across a geographic area, then plots the results on a heat map.
- It replaces a single misleading rank with a distribution, usually 25 to 169 ranks per scan, and shows you exactly where your visibility breaks down.
- Google’s Vicinity update (30 November to 8 December 2021) increased proximity weighting and made single-rank tracking effectively useless for local SEO.
- Major tools: Local Falcon, Local Viking, BrightLocal, Local Dominator, Grid My Business. Pricing starts around USD $20-39/month and scales with scan volume.
- You probably need it if you’re a service area business, ranking unevenly across suburbs, or paying for local SEO and want to know what you’re getting.
What Is Geo-Grid Rank Tracking?
Geo-grid rank tracking is a local SEO method that measures your Google ranking from many specific physical locations at once. A geo-grid rank tracker places a grid of virtual checkpoints over an area, runs your target keyword from each point as if a customer were standing there, and returns a heatmap showing your rank at every location.
Instead of “you rank #3 for plumber Perth”, the tool returns something like “you rank #1 within 800 metres of your address, #6 across Northbridge, and #14 in Mount Hawthorn”. That distribution is the truth. The single number is a story.
The grid replaces a guess with a map. That’s the whole idea.
A Quick Note on “Geogrid” vs “Geo-Grid”
If you’ve searched “geogrid” and seen results about soil reinforcement, polyester mesh, and Tensar, that’s the civil engineering meaning. A geogrid in construction is a geosynthetic product used to stabilise retaining walls and embankments.
In local SEO, we mean something completely different. Throughout this guide, “geo-grid” (hyphenated) refers to the digital grid of search checkpoints used to measure local rankings. Some tool vendors style it as one word, geogrid, but the meaning is the same as ours, not the engineering one.
How Does Geo-Grid Rank Tracking Work?
A geo-grid scan has three moving parts: the grid, the keyword, and the simulated searches.
The grid. You set a centre point (usually your business address), a grid size (3x3, 5x5, 7x7, 9x9, 11x11, 13x13, up to 15x15 in most tools), and a spacing between points (typically 200 metres to 2 kilometres). A 13x13 grid is 169 points. A 5x5 grid is 25 points. Each point is a coordinate.
The keyword. You enter one target keyword. “Plumber”, “emergency dentist”, “Thai restaurant”. The tool runs that keyword once from every grid point.
The simulated searches. Modern geo-grid tools like Local Falcon use the Google Maps Places API. They send a request to Google with the latitude and longitude of each grid point and ask, “from this location, what are the top results for this keyword?” Google returns the local pack ranking as if a searcher were standing at that exact coordinate. Older tools use the &uule= URL parameter, which encodes a base64 location string into a Google search query, but that method has become less reliable since 2022 as Google tightened anti-scraping.
The output is a map with one pin per grid point. Each pin shows your business’s rank from that location, colour-coded by performance.
A worked AU example: a Perth plumber running a 9x9 grid at 1 kilometre spacing centred on the CBD covers an 8x8 km square. Roughly the metro core from Subiaco through to Mount Lawley. That’s 81 grid points, 81 simulated searches, 81 ranks for one keyword.
You can run this for any keyword you target. You can run it as often as your budget allows.
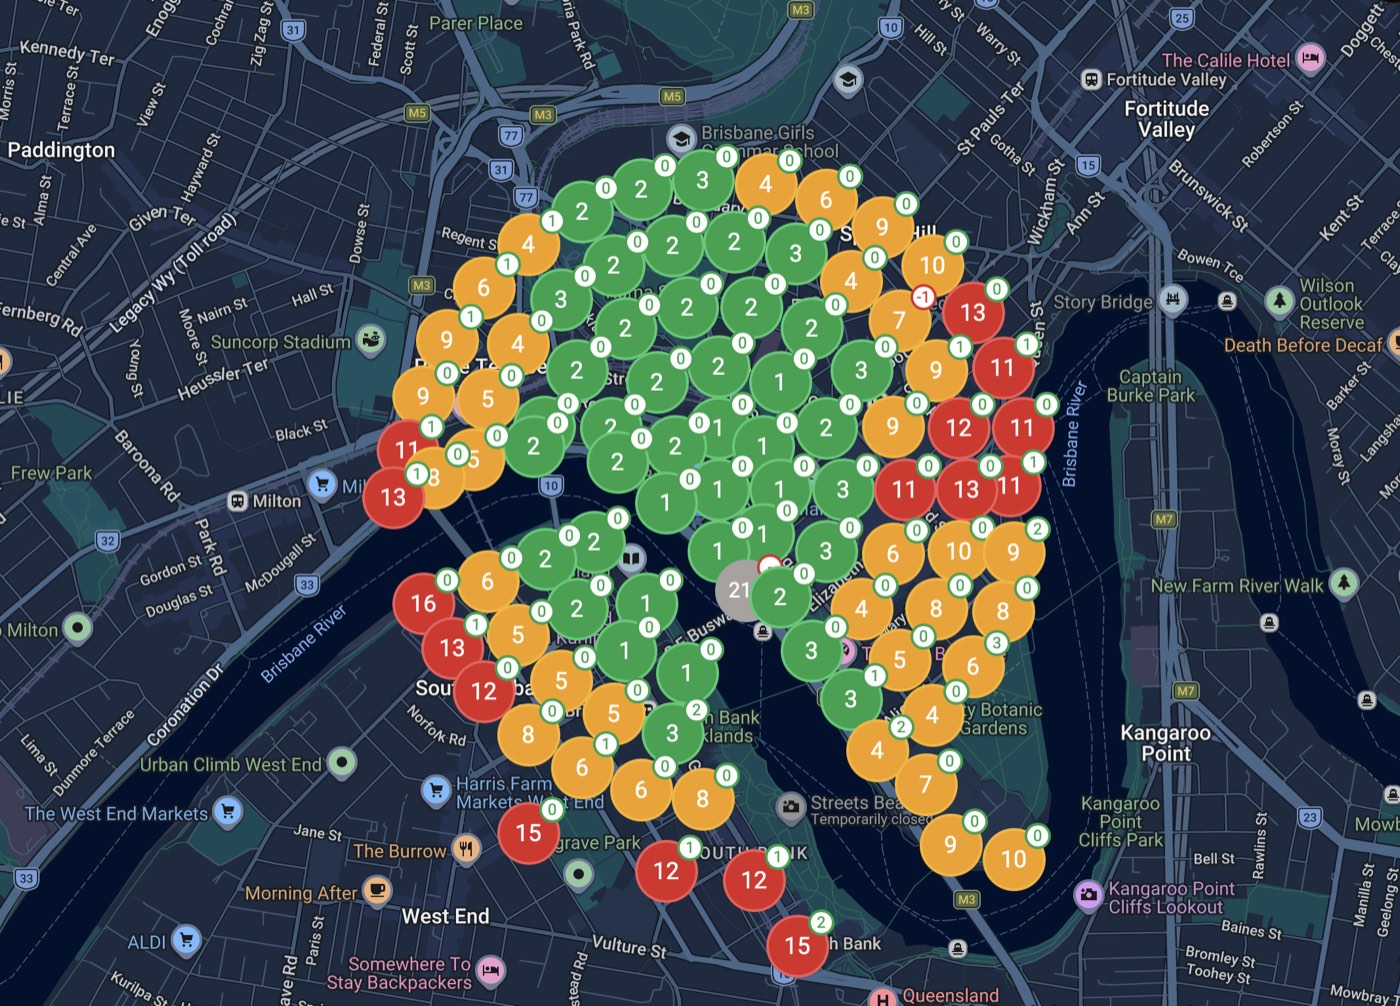
Here is what the before and after of a real campaign looks like on the grid. A Brisbane childcare client of ours, same keyword, same grid, scanned at the start of the campaign and again months in. Before, the green core barely extends past the immediate CBD, with orange and red across South Bank, West End and the eastern fringe:
After, the same grid is green almost edge to edge, with the remaining orange pushed out to the perimeter suburbs:
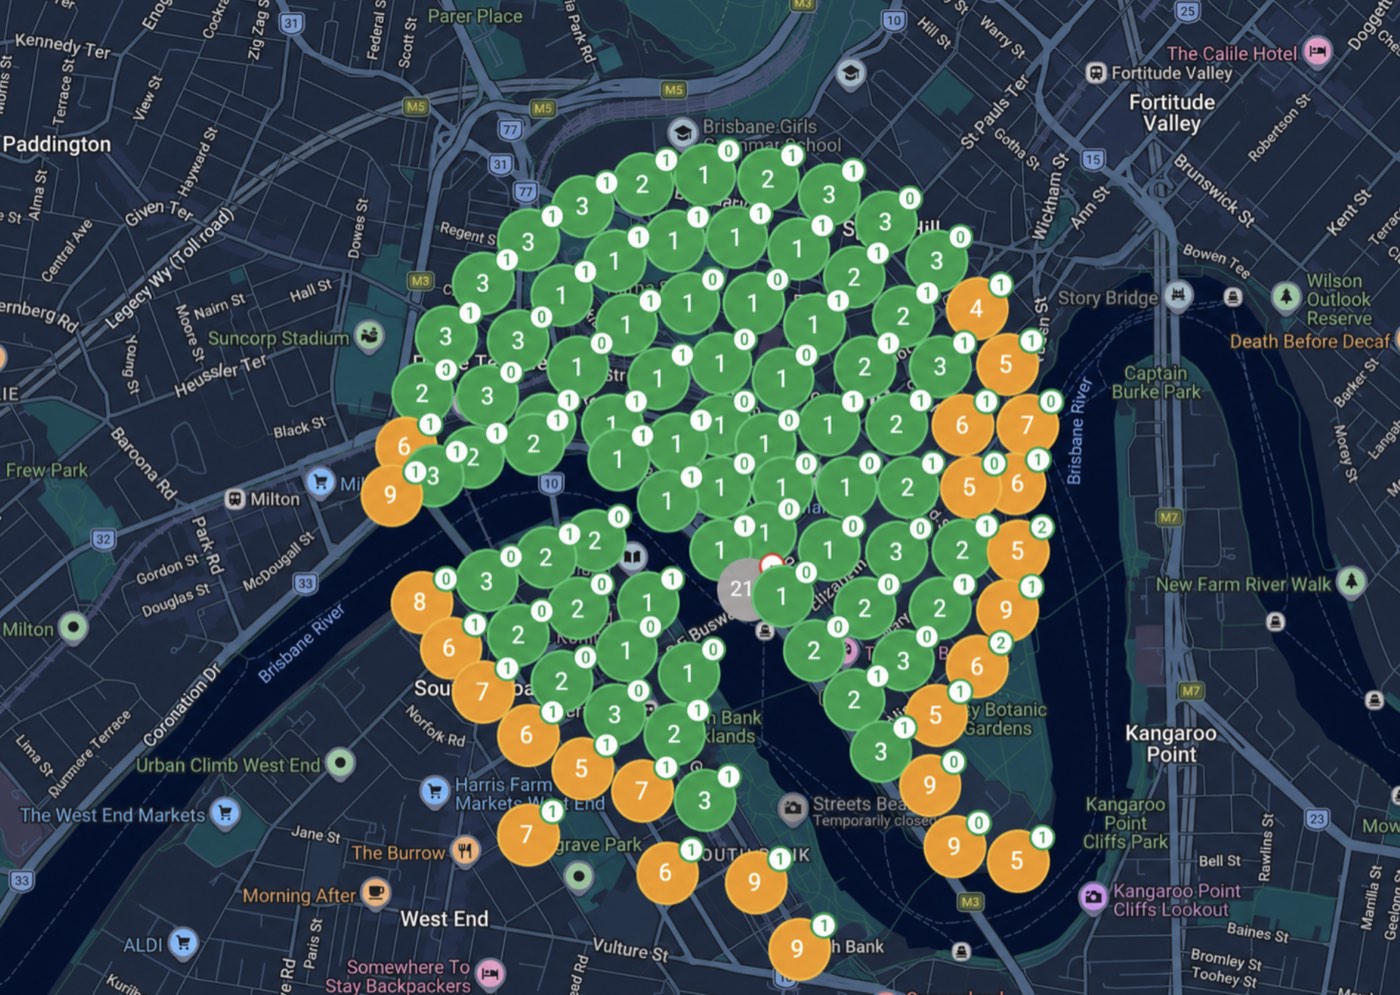
That pair of maps is the whole argument for geo-grid tracking: no single rank number can show you that change, and no client needs it explained.
What Does the Heatmap Actually Show?
The visual output is a grid of coloured pins on a map. The colour convention is industry-standard, not Google-defined:
- Green: ranks 1-3. You appear in the Google Map Pack from this location.
- Yellow/Orange: ranks 4-10. You appear on page one of local results but outside the pack.
- Red: ranks 11+ (some tools use 11-20; some use 20+). You’re effectively invisible to a searcher at this point.
Most tools also display the actual rank number on each pin and aggregate the data into a few summary metrics. Three matter:
AGR (Average Grid Rank). The mean rank across every grid point. The metric most people quote. If your AGR is 3.4, on average across the area you rank between 3rd and 4th. AGR is easy to track over time and the single best snapshot of geographic visibility.
ATGR (Average Total Grid Rank). Similar to AGR but treats results outside the top 20 differently. AGR caps unranked results at 20, which understates how bad an “All Red” map really is. ATGR is more honest for businesses still building visibility.
SoLV (Share of Local Voice). The percentage of grid points where your business appears in the top 3 (or sometimes the top 10, depending on tool). If your SoLV is 28%, you’re in the pack from just over a quarter of the grid. This is the metric that matters most for service area businesses and multi-location brands.
A monthly screenshot of all three on the same scan will tell you whether your local SEO is working faster than any other report I know.
Why Geo-Grid Matters in 2026
Single-rank tracking made sense when local results were mostly the same across a metro area. After Google’s Vicinity update, rolled out from 30 November to 8 December 2021, they weren’t.
The Vicinity update increased proximity weighting in the local pack and reduced the impact of keyword-stuffed business names. The practical effect was that a Subiaco dentist might rank #1 in Subiaco and #11 in Mount Hawthorn for the same keyword. Same profile, same authority, same review count. The only thing that changed was the searcher’s location.
Proximity is one of three official local ranking factors, alongside Relevance and Prominence. It’s also the only one you can’t directly influence; the searcher decides where they’re standing. That makes geo-grid the only way to see what proximity is doing to you.
BrightLocal’s Consumer Search Behavior research consistently finds that 45% of consumers default to Google for local searches, with another 15% defaulting to Google Maps specifically, roughly 60% combined. If most of your customers are running these searches from a phone with GPS, you need to know how you rank from where they actually are.
There’s a quieter reason this matters too. If you’re paying for SEO and your only report is “we’re #4 for plumber Perth”, you’re being shown the friendliest possible number. The geo-grid is the version of the truth your competitors already see. And the version your agency hopes you don’t ask for.

How to Read Your Geo-Grid: Four Common Patterns
After a few hundred geo-grid scans, every map starts to look like one of four shapes. Each tells you something different.
Pattern 1: The Proximity Halo (most common)
Bright green at the centre, fading through yellow, then red at the edges. Strong rank within a few hundred metres of your address, falling away with distance.
This is proximity doing exactly what Google designed it to do. Most healthy local businesses look like this. The fix isn’t to fight the centre. It’s to push the green ring outward by building prominence (reviews, citations, local backlinks) in the suburbs where you’re currently yellow or red.
Pattern 2: The Green Dominator (rare and suspicious)
Green across the entire grid, even at the outer edges. If you see this, check your grid spacing first. You’ve probably set your scan radius too small for the test to be meaningful, and every point is still sitting inside your proximity bubble. Widen the grid before you celebrate.
In genuinely competitive markets, a dentist in inner Sydney with 800 reviews, top relevance signals, and decade-old citations, a green dominator on a wide grid is real. It’s also rare.
Pattern 3: The Competitive Battlefield
Colours scattered across the grid with no clear pattern. Green in patches, red elsewhere, no obvious ring. This usually means several strong competitors are fighting for each cell.
The action here isn’t broad, it’s surgical. Pick the two or three suburbs where you’re closest to flipping yellow into green, build location-specific landing pages, push reviews from customers in those areas, and re-scan in 60 days.
Pattern 4: All Red
Red everywhere except possibly one pin at your business address. This is almost never a normal proximity problem. Common causes:
- Google Business Profile is unverified, suspended, or has the wrong primary category.
- Your business name on Google Maps doesn’t match what you’ve claimed.
- You’re using a hidden address (service area business) but haven’t filled in the service area properly.
- You’re in a brand-new market with zero prominence signals.
Fix the profile before you spend another dollar on SEO. Geo-grid is telling you something more fundamental is broken.
Before you panic: check whether everyone dropped, or just you
One diagnostic almost no owner runs before they start “fixing” their profile in panic. Was the ranking change vertical-wide, or isolated to your business?
BrightLocal’s Local RankFlux tool tracks daily map-pack ranking volatility across 14,000+ keywords industry-wide. Sterling Sky uses it as the first-pass check on every ranking-drop call. If Local RankFlux shows a market-wide volatility spike on the day your rankings shifted, you’re looking at a Google algorithm update, hold steady, keep doing the fundamentals, don’t change anything yet.
If your drop is isolated while the market is calm, the cause is on your profile, your site, or someone editing your listing without you noticing. The fix sequence is different in each case, and changing things in panic during an algorithm update is the single best way to land a self-inflicted suspension.
How Is Geo-Grid Different from a Regular Rank Tracker?
A regular rank tracker (Semrush, Ahrefs, AccuRanker) returns one rank per keyword per location setting. Useful for organic SERPs. Misleading for local pack results.
A geo-grid rank tracker returns 25-225 ranks per keyword per scan, one for each grid point. Useful for local pack and Google Maps. Useless for organic blog rankings.
| Regular rank tracker | Geo-grid rank tracker | |
|---|---|---|
| Output per keyword | 1 rank | 9-225 ranks |
| Best for | Organic SERPs, content sites | Google Map Pack, local SEO |
| Location settings | City or country | Specific lat/lng coordinates |
| What it answers | ”Where do I rank?" | "Where do I rank from everywhere a customer could be?” |
| Typical cost | $50-200/month | $25-150/month |
You usually want both. A local business that ranks for blog content as well as map pack needs a generalist tracker for the blog work and a geo-grid for the map work.
The Major Geo-Grid Tools
There are at least a dozen geo-grid tools on the market. Five matter for most Australian businesses. Worth noting: most of these predate the GMB to GBP rename. “Local Viking” and “Grid My Business” both grew up around the old Google My Business interface and still carry that DNA in their feature design.
| Tool | Starting price (USD/mo, approx) | Grid sizes | AU usable | Notes |
|---|---|---|---|---|
| Local Falcon | ~$25 | 3x3 to 15x15 | Yes | API-based; market leader; AGR/ATGR/SoLV; AI campaign analysis |
| Local Viking | ~$39 | 3x3 to 13x13 | Yes | Coined the “GeoGrid” term; bundled with GBP post scheduling |
| BrightLocal | ~$39 | Up to 13x13 | Yes | All-in-one suite (citations, reviews, geo-grid) |
| Local Dominator | ~$39 | Up to 11x11 | Yes | Credit-based; AI analysis layer |
| Grid My Business | Free / paid tiers | Up to 9x9 | Yes | Lightweight; one-off scans free |
These are starting prices. Real costs scale with the number of locations you track, the size of each grid, and how often you scan. Scale matters more than tier name.
What to look for in a geo-grid tool
If you’re choosing between them, the things that actually matter day-to-day are:
- API-based scanning (not URL parameter scraping). More accurate, less likely to break when Google tweaks something.
- Grid sizes up to 13x13 minimum. Anything smaller will undercount edge-of-service-area performance.
- AGR, ATGR and SoLV reported on every scan. Tools that only show AGR hide the bad days.
- Competitor overlay on the same grid. Without it, you’re guessing what “good” looks like.
- Historic scan storage of at least 12 months. Local SEO is a trend game; one quarter of history isn’t enough.
For a deeper breakdown of features, accuracy, and reporting, see our comparison of the best geo-grid local ranking tools. At Search Scope we use Local Falcon for client work. Not because it’s the only good one, but because the API methodology, grid sizing, and reporting depth fit how we like to run campaigns. Your needs may differ.
Do You Actually Need Geo-Grid Rank Tracking?
Be honest about this. Geo-grid isn’t free, and not every business needs it.
You probably need it if:
- You’re a service area business (plumber, electrician, mobile mechanic) servicing multiple suburbs.
- You have a storefront and customers within a 10+ km radius matter to your revenue.
- You operate from multiple locations and want to spot cannibalisation between them.
- You’re paying Perth SEO specialists or an in-house team and want to verify what you’re getting.
- You’re trying to expand visibility into specific suburbs and need to measure progress objectively.
You probably don’t need it if:
- You’re a destination business and all your customers come to you from a wide area (a niche bridal store, a specialised medical clinic with no local competition).
- You operate online-only with no physical service component.
- You have one location, one keyword, and you already dominate the Map Pack in a small town.
If you’re somewhere in between, run a single one-off scan with Grid My Business or Local Falcon’s free tier before you commit to a monthly subscription. One scan will usually tell you whether the pattern justifies the spend.
How Often Should You Scan, and What Does It Cost?
Most geo-grid tools price by scan credits. One credit = one grid point = one simulated search for one keyword. The maths is unforgiving once you start running large grids.
- 9x9 grid × 1 keyword × 1 scan = 81 credits
- 13x13 grid × 1 keyword × 1 scan = 169 credits
- 13x13 grid × 5 keywords × 1 scan = 845 credits
- 13x13 grid × 5 keywords × weekly for a month = 3,380 credits
A typical entry tier ships around 600-1,000 credits per month. Easy to burn through in a fortnight if you’re not careful.
Sensible cadence guidance:
- Daily scans: almost always overkill. The signal-to-noise ratio is poor; local rankings rarely move enough day-to-day to be worth reading. Burns credits fast.
- Weekly scans: sensible during active campaigns or when you’ve just shipped a major change (new location page, GBP category change, big review push).
- Monthly scans: the default for most clients. Enough to see real trend over a quarter without going broke.
- Quarterly scans: fine for low-velocity businesses or stable rankings.
A practical rule: scan often enough to see trends, not so often that you mistake noise for signal.
Common Mistakes When Reading a Geo-Grid
After looking at hundreds of these maps, the same misreads come up:
Treating a snapshot as gospel. One scan is one moment. Local rankings move. Always compare two or more scans before you draw a conclusion.
Ignoring the AGR trend. A 0.3 improvement in AGR over a month is more useful than any single map. Trend beats snapshot.
Setting the grid too small. A 3x3 grid at 200m spacing covers 400 metres total. You haven’t tested proximity, you’ve tested the same patch of footpath four times.
Setting the grid too large. A 15x15 grid at 5km spacing in suburban Perth covers most of the metro. The outer pins are scanning suburbs where you have no realistic intent to compete. You burn credits on noise.
Comparing scans with different grid centres or sizes. Change the grid, change the dataset. Lock your grid settings before you measure progress.
Confusing geo-grid with Google Map Pack ranking factors. Geo-grid measures what’s happening. It doesn’t tell you why. The fix work is still relevance, prominence, and a healthy profile.
AU Grid Spacing: A Quick Rule of Thumb
Density varies wildly across Australian cities. One spacing doesn’t fit all.
- Sydney / Melbourne CBD: 200-300m spacing for inner-city businesses; 9x9 to 13x13 grid sizes
- Perth, Brisbane, Adelaide metros: 500m-1km spacing; 9x9 to 11x11
- Regional cities (Geelong, Newcastle, Wollongong): 1km spacing; 7x7 to 9x9
- Rural and remote (Bunbury, Wagga, Cairns hinterland): 2km spacing; 5x5 to 7x7
These are starting points. If your green ring extends well past your grid edges, widen the spacing. If you can’t see a clear pattern because the grid is too sparse, tighten it.
There’s no universal default, and that’s the point. Grid spacing isn’t a fixed recipe you copy from a “practitioner standard”, it’s a function of how contested the keyword is. In our own geo-grid work across client accounts, contested terms (the ones with real competition) collapse to a tight ~1.5-2km radius before rank falls off a cliff, while uncontested terms hold steady across a much wider ~9km box. That’s why the density-based spacing guide above matters more than any single grid size. Run your first scan at the spacing that matches your market density, then widen or tighten based on where your own green ring actually stops. Whitespark added its own grid tracker in August 2025, joining Local Falcon, BrightLocal, and Places Scout. Pick on integration fit and reporting style rather than feature count.
Frequently Asked Questions
How is a geo-grid different from a regular rank tracker?
A regular rank tracker gives you one rank per keyword per location setting (usually a city or country). A geo-grid tracker gives you 25-225 ranks per keyword per scan, one for each point on a grid covering your service area. Geo-grid is purpose-built for Google Map Pack and local results, where ranking changes from street to street. Regular trackers are better for organic SERPs and blog content.
How often should I run a geo-grid scan?
Monthly is the default for most local businesses. Weekly during active campaigns or right after a significant change to your Google Business Profile or website. Daily scans are almost always overkill; local rankings don’t move fast enough day-to-day to make the credit cost worth it.
How accurate are geo-grid scans?
Tools that use the Google Places API (Local Falcon, BrightLocal, most modern platforms) are close to what a searcher at that coordinate would actually see, but they’re not identical. Real users have personalisation, search history, account preferences, and device signals layered on top. Geo-grid is the best objective measurement available, but treat the absolute numbers with healthy scepticism. Trends and patterns are more reliable than single ranks.
Is there a free geo-grid rank checker?
Grid My Business and Local Falcon both offer limited free scans. They’re fine for a one-off look but won’t sustain ongoing tracking. For weekly or monthly scans, you need a paid plan; entry tiers start around USD $20-40 per month.
Can I track competitors with geo-grid tools?
Yes. Every major geo-grid tool lets you add competitors to the scan. You see their heatmap overlaid with yours, which makes it easy to spot their strongholds and your gaps. Competitor tracking is one of the most useful features of the format.
Are geo-grids important for service area businesses (SABs)?
For SABs, geo-grid isn’t optional. It’s the only honest measurement. SABs don’t have customers walking into a physical location; they have customers searching from across a service area. Knowing where you’re visible across that area is the whole point. AGR and SoLV are the metrics to track.
What’s a good Average Grid Rank score?
There’s no single answer because it depends on competition and how wide your grid is. As a rough guide for a 9x9 to 13x13 grid in a competitive Australian metro: under 3 is dominant, 3-6 is healthy, 6-10 is competitive, 10+ means you have work to do. The trend matters more than the absolute number.
Closing
Geo-grid rank tracking won’t improve your local SEO on its own. What it does is make it possible to see what’s actually happening, set a baseline, and measure whether the work you’re doing (reviews, content, profile optimisation, citations, links) is actually moving the map.
For most Australian local businesses, that’s the difference between paying for SEO and paying for guesswork. If you want to improve your local SEO with any confidence, the geo-grid is the scoreboard you measure against.
If you’d like a second pair of eyes on your current geo-grid data, or you’re not running scans yet and want to talk about whether they make sense for your business, . No sales pitch. Just a look at what your map says and whether geo-grid tracking would change anything for you.