Google Business Profile Insights Guide
A practical Australian guide to reading Google Business Profile insights and turning the data into more calls, directions and bookings.
Most Australian business owners I meet have the same problem with their Google Business Profile insights. They log in, see a wall of numbers, and walk away with no idea what to actually do differently on Monday morning.
That’s not their fault. Google has rebadged “Insights” into “Performance,” moved the report out of the old dashboard, and quietly retired or redefined half a dozen metrics in the last two years. If the last time you checked was 2022, the screen you’re looking at today is a different product.
This guide is the version I wish more clients had read before our first call. I’ll walk you through where the data lives now, what each metric actually tells you, and the small handful of moves that turn that data into more phone calls and more job-site visits.
Here’s what you’ll get out of it:
- Where the data lives now: performance reports sit inside Google Search and the Maps app, not the old
business.google.comdashboard. - The metrics worth your time: profile interactions, search queries, calls, directions, website clicks, bookings.
- How to read the Searches breakdown: including the Direct, Discovery and Branded split Google retired, and what replaced it.
- A weekly 10-minute review: the only template you need to actually stick to it.
- Why your data might be missing: and what to do about each cause.
What Are Google Business Profile Insights (And What Actually Changed)?
Google Business Profile insights are the performance reports Google gives every verified business on Google Search and Google Maps. They tell you how people found your profile, what they searched, and what they did next, calls, directions, website clicks and bookings.
They’re free and they live inside your own profile, but they don’t all refresh at the same speed. Interactions (calls, directions, website clicks, bookings) update daily. Views and searches update once a month, and Google warns the searches metric “is updated at the start of each month” and “might take up to 5 days to show up”. Anything you compare week to week has to come from the interactions half.
A quick recap of what changed:
- Around late 2022, Google retired the standalone
business.google.comdashboard for most single-location businesses. - The old “Insights” tab was replaced by a leaner Performance report living inside Google Search and the Google Maps app.
- Views still exists as its own metric, but it changed underneath: it now counts people rather than raw impressions, capped at once per person per day within each of four buckets (Search or Maps, mobile or desktop). Same profile, smaller-looking number.
- Call history (timestamps, duration, caller volume) was removed on 31 July 2024. What’s left is a count of call-button clicks.
- Messaging was shut down globally on the same date. Google’s help page still lists a Messages metric, which is stale documentation rather than a feature you can use.
The underlying signal hasn’t changed though. This is still the closest thing to free Keyword Planner data a local business will ever get. You just have to know where to look.
Where to Find Your Business Profile Performance Report
You no longer manage the profile from a dedicated dashboard. You manage it directly from Search or Maps while you’re signed into the Google account that owns the listing.
On desktop
- Open Google and search for your own business name.
- Make sure you’re signed in to the Google account that owns the profile.
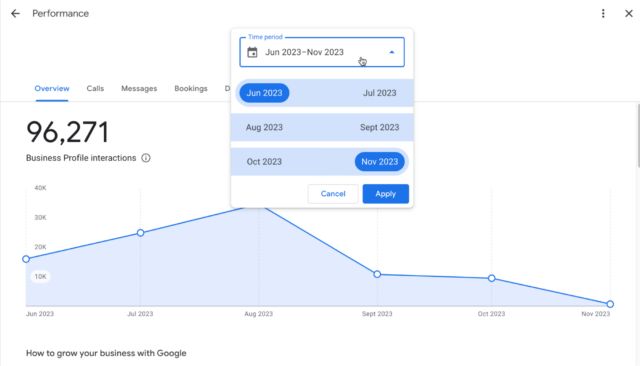
- A management strip will appear at the top of the results, click Performance.
- Choose the timeframe. The selector works in whole months, from one to six. There is no last-7-days or last-28-days preset, which catches out anyone arriving from Search Console or GA4.
If the management strip doesn’t appear, you’re either signed in to the wrong account, the profile is suspended, or you don’t have access (a common pain point for marketers handling client profiles).
On mobile (Google Maps app)
- Open the Google Maps app and tap your profile picture (top right).
- Tap Your Business Profile.
- Tap Promote, then Performance.
- You’ll see the same timeframe selector and the same core metrics, calls, directions, website clicks and searches.
The mobile view is the one most owners I work with end up using. Takes 60 seconds to check in the morning, which is the whole point.
The Five Metrics That Actually Matter
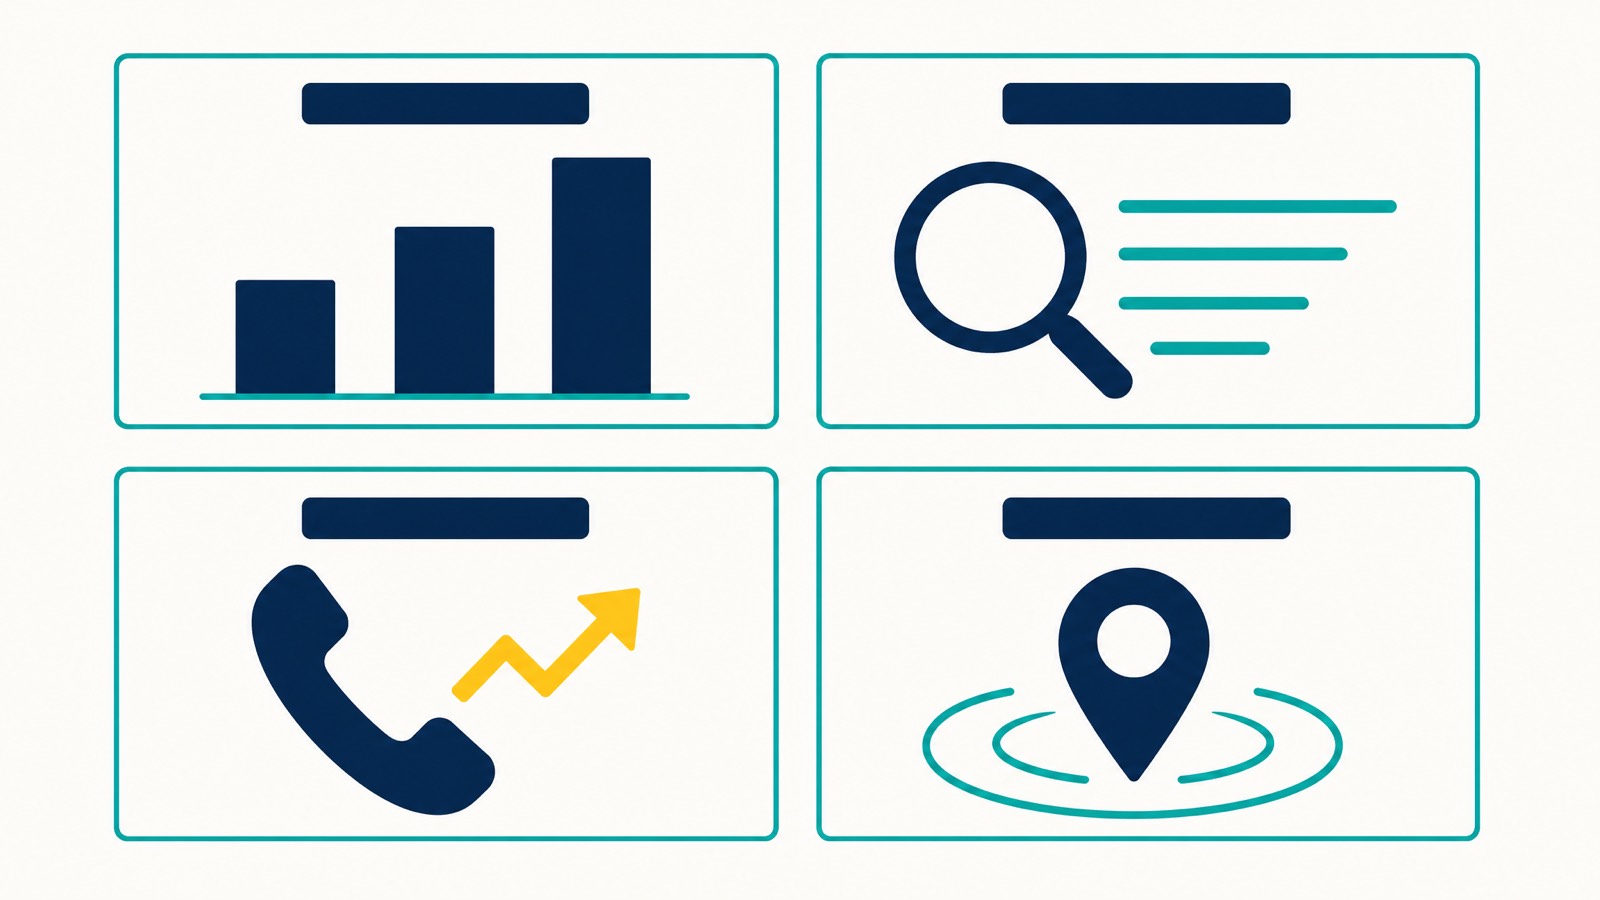
Google shows you a lot of numbers. Five of them earn your attention each week.
1. Business Profile interactions. The headline metric. Calls, direction requests, website clicks, bookings and, where they apply, product, menu and offer views all roll into this figure. One caveat Google states plainly and almost nobody accounts for: “performance data includes views, searches, and actions from both organic search results and Google Ads”. If you run Ads to the profile, this number is not purely organic. Use it as your “heartbeat” number, month-on-month direction matters more than the daily reading.
2. Searches breakdown (search queries). The list of actual phrases people typed before landing on your profile. This is the gold. More on it in a minute.
3. Number of calls. Calls made by tapping the call button on your profile, and nothing else. There is no split between profile calls and calls placed after a website visit, so if you want that distinction you need call tracking on the receiving line.
4. Directions requests. How many people tapped to get directions to your address. Not available to service-area businesses with no public address. Strong proxy for foot-traffic intent, especially for hospitality, retail and home-base trades.
6. Website clicks. Taps on the website link from your profile. Drops here often mean your hours, services or photos look incomplete next to a competitor.
5. Bookings. Only relevant if you’ve enabled Reserve with Google or a supported booking partner. Where it exists, it’s the cleanest revenue-attribution metric Google gives you, because it ties to a completed transaction rather than a click.
If you want a fuller field guide to reading each one in context, I’ve written a companion piece on how to interpret Google Business Profile metrics.
Name Searches Versus Category Searches (And The Split Google Retired)
If you learned Business Profile reporting before 2023 you’ll be hunting for the pie chart that split searches into Direct, Discovery and Branded. It’s gone. Google retired that model in February 2023, so any guide still telling you to track your Direct-to-Discovery ratio is describing a screen you no longer have.
What replaced it is better in one way and worse in another. Better: you get the actual search terms people used. Worse: Google no longer labels which ones were name searches, so you classify them yourself.
That takes about two minutes. Copy the query list into a sheet and tag each row “name” or “category”. The diagnosis the old chart used to hand you is still available, you just do the sorting.
| Pattern you see | What it means | What I’d do |
|---|---|---|
| Mostly name searches | You’re known to your existing audience but invisible for category searches. | Audit your primary category, add secondary categories, expand your services list, look at proximity issues. See Google Maps proximity ranking. |
| Mostly category searches | You’re reaching people who didn’t know you, but nobody’s searching your name yet, weak brand recall. | Lean into Posts, photos and offline brand-building. Reviews mentioning your business name help here. |
| Both growing month on month | You’re doing the work and your local SEO is compounding. | Don’t change the playbook. Add cadence with Google Business Profile posts. |
| Both flat or falling | Suspension risk, recent category change, or new competitor in the pack. | Check status, run a geo-grid scan, audit categories and attributes. |
That last row is where a geo-grid ranking tool earns its keep, the performance report alone won’t tell you whether a competitor moved into your suburb.
Search Queries: The Most Underused Asset In GBP
If you do one thing with your insight data this month, do this.
Scroll to the Searches section and look at the actual queries people typed before Google showed them your profile. It’s the closest thing to free keyword research for your own market. One limit to keep in mind: the list tells you which searches your profile appeared for, not that anyone interacted with you on them.
What I want you to do with it:
- Set the range to the last three completed months and export the search queries.
- Sort by impressions and pull out anything you don’t currently mention on your profile or website.
- Add those phrases, naturally, to your business description, your services list, your products and the page on your website that maps to that intent.
- Re-check in 60 days. You’ll usually see those exact category phrases start appearing in the searches list.
The reason it works is simple. Google sees your profile is now obviously associated with that phrase, both on the profile itself and on the linked site. The next time someone searches it nearby, you’re a stronger match.
For most of my Perth clients, this single loop has done more for category-search visibility over the last 18 months than posting or chasing reviews.
Calls, Directions And Website Clicks, Turning Interactions Into Actions
Before you read any of the interactions trends, know what the numbers actually count. The single biggest attribution gap in the dashboard is the “Calls” metric: it counts taps on the call button, not connected calls.
Sterling Sky has documented this directly. Google has no way to track whether the call connected, how long it lasted, or whether anyone answered. A lot of the recorded taps are people who hit the button by accident on mobile, or tapped and closed the dialler before dialling.
If you want a real count of connected calls, you need call-tracking software on the receiving line. The GBP dashboard number is a directional signal, not a measurement.
The interactions metrics tell you what people did. The job is to read the trend, not the daily number.
- Calls trending up, website clicks trending down. Buyers are deciding from your profile alone. Make sure your profile has the answers, hours, services, photos, attributes. If your prices are an objection, address them in your description and Posts.
- Directions up, calls flat. People are coming to you in person. Double-check Google’s listed entrance, parking notes and accessibility attributes. Add fresh photos of the front of the building.
- Website clicks up but no calls or directions. Your profile is doing the heavy lifting but your website isn’t converting. Audit your landing page CTAs. A common fix is making the phone number a tap-to-call button on mobile.
- Everything flat for six weeks or more. Likely a ranking or visibility issue, not a profile-content issue. Run a geo-grid scan and check whether your primary category has been auto-changed (this happens more than people realise).
The interactions metric isn’t a marketing scorecard. It’s a diagnostic instrument. Read it that way.
When GBP clicks go down but your business is up
Local service businesses started reporting a pattern in 2025 that’s accelerated through early 2026. GBP-reported clicks and calls drop, sometimes sharply, while the actual phone keeps ringing and bookings keep landing.
Basaropt’s analysis traces it to converging shifts. AI Overviews are answering more queries before the user clicks anything, and AI agents (ChatGPT, Gemini-backed assistants) are calling businesses directly on behalf of users, none of which registers as a click-to-call on your profile. The analysis also blames Local Services Ads for taking attribution above the map pack, but that one doesn’t apply here: Google Local Services Ads still aren’t available in Australia.
If your overall lead volume is steady or up while the GBP dashboard says you’re trending down, you’re seeing attribution drift, not a real performance drop. Fix the measurement before you fix the profile. Track total inbound leads via your phone system or a call-tracking service, your CRM, and GA4 conversions, then triangulate against GBP. The dashboard alone is an increasingly partial picture.
What “good” looks like in 2026
Three benchmark points worth knowing, because the dashboard gives you numbers without context.
- View-to-action conversion rate. BrightLocal’s study of 45,000 listings found the average profile takes 59 actions off 1,260 views a month, about 5%. Read it as a shape rather than a target: that study ran on 2017 to 2018 data, and Google changed how it counts views in 2023, so today’s dashboard reports a smaller view number for the same profile.
- Click-to-call rate by industry. WebFX puts clicks-to-call at 5% to 8% of views across all industries, doubling to 10% to 15% for service businesses like plumbers and roofers.
- Action mix. In the same BrightLocal data, website clicks are the biggest slice at around 56% of all actions (roughly 33 clicks a month). Australian listings ran ahead of the average on both website clicks (36) and calls (18), with a median of 67 total actions.
Use these as direction-of-travel, not as targets.
Do behavioural signals feed your rankings?
You’ll see this claim a lot in 2026, so here’s where it actually stands. Koira’s May 2026 local-SEO update tracker reports that behavioural signals from your profile, calls, direction requests and website clicks, now do more for map-pack position than a keyword-stuffed description or a padded category list.
Treat that as a working theory rather than a confirmed mechanic. Google has never said interaction counts feed back into rankings, the tracker credits independent analysts rather than any Google statement, and its own wording is that behavioural signals are increasingly the tiebreaker between profiles already competing in the same radius. That’s a narrower claim than a ranking factor.
The practical answer doesn’t change either way. A profile earning real calls and direction requests is doing the job you hired it for. Just don’t rebuild your strategy around a mechanic nobody has confirmed.
Bookings, Food Orders And Messages, When They Apply
Three more metrics that only show up when relevant.
- Bookings. Visible if you’ve connected Reserve with Google or a supported booking partner (e.g. healthcare and beauty providers using approved scheduling tools). Highest-trust metric in the report because it ties to a real transaction.
- Products, menus and offers. Visible for the categories they apply to, counting views and clicks on that content.
- Food orders and messages. Both gone. Google stopped recording the food orders metric in June 2024, and chat was shut down on 31 July 2024. Ordering still works through partners, the reporting doesn’t.
If none of these apply to your business, don’t lose sleep over them. Focus on the core five (interactions, queries, calls, directions, website clicks).
How To Download Your Business Profile Performance Data
For anything more than a quick glance, get the data into a spreadsheet.
Single profile
From the Performance report, choose your date range and use the download option on individual sections (calls, queries, directions). It exports as a spreadsheet you can drop into Sheets or Excel.
Multiple profiles (bulk)
If you manage multiple locations through Business Profile Manager, use the bulk insights download to pull performance data for every location in one spreadsheet. This is what every agency dashboard runs on underneath. I lean on it for monthly client reports and for spotting locations that are quietly drifting.
If your data is locked into an agency tool you can’t access, ask for the raw bulk export. Real data, in your spreadsheet, you own.
A Weekly 10-Minute Business Profile Review
This is the routine I give every client. Ten minutes, every Monday.
- Open the Performance report on mobile. Set it to the current month. Interactions update daily, so that’s the half of the report that actually moves week to week.
- Look at total interactions. Up, flat or down? Note the direction.
- Scroll to Searches. Skim the top 10 queries for anything new. This one refreshes monthly, so it’s a first-of-the-month job rather than a weekly one.
- Check calls, directions and website clicks as a group. One up and others down is normal. All three down is a flag.
- Open your profile as a customer. Search your business in an incognito window. Are photos, hours and services correct? Anything a competitor is showing that you aren’t?
- Add one Post. Doesn’t have to be fancy. A recent job, this week’s special, a current offer.
- Reply to any new review in the same session.
- Log the numbers in a simple sheet (date, interactions, calls, directions, website clicks). Three months of this and your trends become obvious.
Ten minutes, once a week. It beats the quarterly “GBP audit” almost every time, because you catch drift while it’s still small.
Troubleshooting: Missing Data, Dropped Views, Suspended Profile
When the report looks wrong, the cause is almost always one of these:
- Profile is too new. Interactions start populating quickly, but searches update monthly, so a profile verified mid-month can look empty until the next cycle lands.
- Not enough activity. Under low volume some sections just show “no data yet”. Google doesn’t publish the threshold. Keep posting, keep gathering reviews.
- Profile suspended or unverified. No Performance button at all. Check the help centre for suspension messaging and start the appeal. We do this work every week, so if you’re stuck, our Google Business Profile reinstatement service is the page you want.
- You’re signed into the wrong Google account. The single most common cause I see. Sign out, sign back in with the owner account.
- Recent change to your primary category. Category-term impressions can dip while Google re-classifies you. If the change was deliberate, ride it out. If it was automatic, revert it.
- New competitor in the local pack. Your data didn’t drop, theirs rose. A geo-grid scan will confirm.
- Wrong date range. Easily missed, and the trap runs the opposite way to what people expect. The selector deals in whole months, so a wide range smooths a recent drop into invisibility. Narrow it to a single month before concluding nothing has changed.
If you’ve ruled all those out and your numbers are still strange, the issue usually isn’t the report. It’s the underlying profile health. That’s the point to bring in a second pair of eyes.
One last possibility worth checking: a reporting glitch on Google’s side. Street Fight documented one in July 2025 where impression counts dipped across a range of sectors and geographies while engagement metrics (clicks, calls, directions) held steady, and Google confirmed it as a reporting glitch. That pattern, one metric down while the others stay flat, points at a reporting bug rather than a real visibility loss. Before you act on it, check the Local Search Forum or the GBP Help Community to see whether others are reporting the same anomaly.
When To Bring In Help
If you’re spending more than an hour a week trying to make sense of your insights, or you’ve noticed a sustained drop you can’t explain, that’s the signal to talk to someone.
I’m Dorian. I’ve been doing SEO since 2013 and founded Search Scope in 2021 to help Australian businesses win on Google Maps and local search. We work with tradies, clinics, hospitality groups and service businesses across Perth and Australia-wide.
If you’d like a second opinion on what your insights are telling you, , no pitch, just a straight read of your numbers. Or email seo@searchscope.com.au.
For broader context, our Google Maps SEO and local SEO pages cover what comes after you understand the data.
Frequently Asked Questions
Is Google Business Profile Insights free? Yes. Performance data is included with every verified Business Profile on Google. There’s no paid tier and no upgrade.
Can I see how many times my business name has been searched? Yes, in the sense that your name searches appear in the Searches breakdown alongside everything else. Google retired the Direct, Discovery and Branded grouping in February 2023, so you now get a plain list of queries and sort them yourself.
How far back does the data go? Up to the past 6 months on a rolling basis. If you need a longer history, export to a spreadsheet monthly.
Where did Google My Business Insights go? The old Insights tab was retired with the rest of the legacy Google My Business dashboard. Everything now lives in the Performance report inside Google Search and the Google Maps app.
Why are my views lower than they used to be? Views still exists, but it changed. It now counts people rather than impressions, and a person is only counted once a day within each of the four Search/Maps by mobile/desktop buckets. Same visibility, smaller number. Interactions is a separate metric counting actions (calls, clicks, directions), not a replacement for views.
How do I see insights for multiple business profiles? Use the bulk insights download inside Business Profile Manager for multi-location accounts. It exports all locations into one spreadsheet.
Do GBP attributes affect my insights? Yes, indirectly. Attributes change which discovery filters your profile appears in (e.g. “wheelchair accessible”, “outdoor seating”).
What’s the fastest way to lift my Discovery searches? Mine your Searches breakdown for queries you don’t currently mention, add them to your services and description, and reinforce them on the matching page of your website. Re-check in 60 days.
The short version
Read the interactions weekly, read the searches monthly, and treat both as diagnosis rather than a scorecard. If you would rather hand off the weekly work, our Google Business Profile management service covers it.