Australian Internet Statistics 2026 – Deep Dive Report
Explore the latest Australian internet statistics for 2026. Discover trends in usage, mobile adoption, social media, e-commerce, streaming, and cybersecurity with insights for businesses and policymakers.
Australia entered 2026 with 97.1% of the population online, 34.1 million mobile connections (126% of the population), and 21.0 million social media users (Datareportal Digital 2026 Australia).
The 2026 picture is less about reaching more people online (that work is done) and more about three shifts: how Australians use AI in everyday search, how e-commerce has accelerated past 24% of total retail, and how the gap between metropolitan and regional infrastructure now defines who wins which markets.
This report pulls the headline numbers from DataReportal Digital 2026, Meltwater, ACMA, Ookla, the ASD Annual Cyber Threat Report, and Statcounter’s latest market-share data. Every figure is linked to its source.
It is designed to be your most authoritative AU-specific reference for 2026 planning, with the data points business owners, marketers and policymakers actually need.
1. Digital population and 7-year trends
| Year | Population | Internet Users | % Penetration | Social Media Users | Mobile Connections |
|---|---|---|---|---|---|
| 2019 | 25.3 M | 20.0 M | 79% | 16.0 M | 24.0 M (95%) |
| 2022 | 26.0 M | 24.5 M | 94% | 19.8 M | 29.0 M (112%) |
| 2025 (start of year) | 26.88 M | 26.10 M | 97.1% | 20.9 M | 34.4 M (128%) |
| 2026 (start of year) | 27.0 M | 26.2 M | 97.1% | 21.0 M | 34.1 M (126%) |
Source: Datareportal Digital 2026 Australia, GSMA Intelligence, Kepios.
Internet penetration in Australia, 2019 to 2026
Online penetration has plateaued at 97.1%. The remaining 2.9% is the practical ceiling. Source: Datareportal Digital 2026.
Why it matters
- Internet users have reached effective saturation at 97.1%. The growth story moved on years ago.
- 34.1 million mobile connections = 126% of the population, indicating heavy multi-device use across phones, secondary lines, IoT and wearables.
- 21.0 million social media users (77.7% of the population) is up modestly YoY; the market is mature, not growing fast.
The remaining 2.9% offline population is mostly remote communities, very elderly residents, or conscientious digital abstainers. They are a real cohort but require alternative engagement, not digital marketing.
The 126% mobile connection rate means a multi-device ecosystem. For marketing, that demands cross-device tracking and attribution, not just mobile-first design.
2. Device usage and time online
Source: DataReportal Digital 2026 and Meltwater.
Device access share (% of internet users)
- Mobile phones: 95.7%
- Laptops/desktops: 74.1%
Average daily time online
- Total: 5h 52m per day (about 41h 3m per week)
- 19h 28m per week on social media
Broadband and mobile speeds (2026)
- Median fixed download: ~164 Mbps (Ookla via WorldPopulationReview, late 2025)
- Median mobile download: ~128 Mbps
- Fixed broadband still runs faster than mobile after NBN’s 2025 higher-tier upgrades
Fixed download speeds jumped in late 2025 with NBN’s tier upgrades, keeping fixed comfortably ahead of mobile. 5G is maturing behind it: adoption is forecast around 60% of subscriptions in 2025, rising toward 70% in 2026 (GlobalData).
What it means
The single most actionable shift in the device data is how much of online life runs on a phone: smartphones are the primary access device for 95.7% of internet users. Even with fixed broadband faster than mobile on raw speed, mobile-first is no longer optional, it is the baseline.
3. Search behaviour and SEO context
Search engine market share (combined desktop + mobile, late 2025 / early 2026)
| Engine | Share (all platforms, AU) |
|---|---|
| 88.0% | |
| Bing | 9.0% |
| Yahoo | 1.6% |
| DuckDuckGo | 0.9% |
| Other | 0.5% |
Source: StatCounter Search Engine Market Share, Australia (June 2026).
Search engine market share in Australia, 2026
Google sits near 88% while Bing has climbed to about 9% through 2026, largely on Microsoft Copilot and Edge defaults. Source: StatCounter, Australia (June 2026).
What changed in 2026
Two surprises from the 2026 data:
- Bing has risen, not fallen. On the back of Microsoft Copilot and Edge defaults, AU Bing share climbed to about 9% through 2026 (from roughly 6.6% in January).
- Google slipped to about 88%, down from the mid-90s a couple of years ago, though it remains overwhelmingly dominant.
What Australians ask AI
ROI.com.au’s January 2026 analysis surfaced three more data points relevant to anyone planning organic visibility in 2026:
- ChatGPT awareness: 76% of Australians
- ChatGPT monthly usage: 31%
- Google AI Overview encounters: 64% of users
That last figure is the one to watch. AI Overviews are now a regular feature of most Australian Google searches, and they reduce click-through to organic results. More context in our search engine usage in Australia report and our piece on AI and local search.
For local businesses, the priority is unchanged: master Google’s local search factors and mobile-first indexing. AI Overviews and ChatGPT are now an additional surface, not a replacement for organic visibility.
4. Social media platform reach (2026)
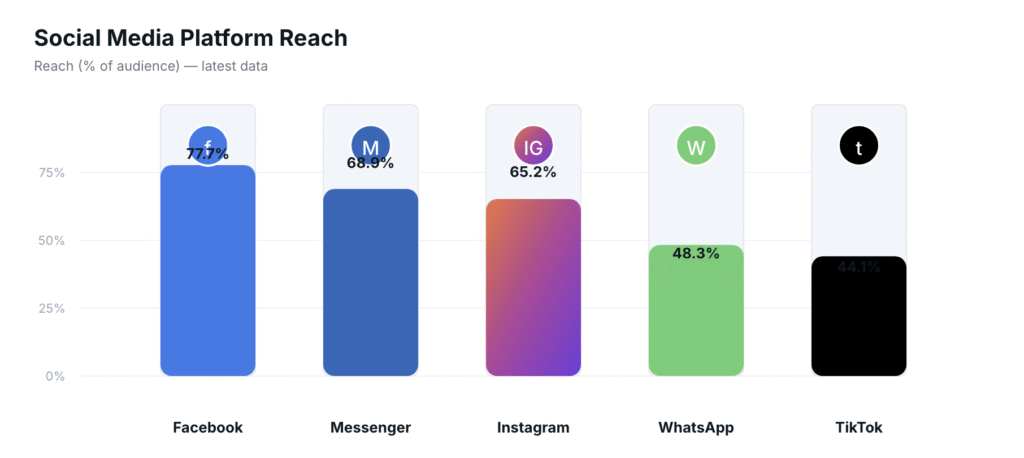
Platform reach among Australian social media users
- Facebook: 80.6%
- Messenger: 68.0%
- Instagram: 65.9%
- YouTube: 60.9%
- WhatsApp: 52.2%
- LinkedIn: 18.0 million registered members in late 2025 (+12.5% YoY); that equals ~85% of adults, but counts registered accounts, not active users
- TikTok: 10.9 million ad reach (+13.9% YoY)
- Reddit: a very large reported YoY jump in AU ad reach, which DataReportal itself flags as a data anomaly rather than verified organic growth
Source: Meltwater 2026, Sprout Social April 2026.
What’s actually shifted in 2026
- Reddit’s reported AU surge is eye-catching but flagged by DataReportal as a reporting anomaly (its ad tool shows reach above the eligible population), so treat the exact figure with caution. Reddit is still a genuine and growing venue for authentic, community-driven brand research, worth a serious look.
- Instagram’s ad reach now equates to 57% of the total population; in-app shopping has measurably driven sales for AU brands.
- TikTok added 13.9% YoY, slower than its 2024 surge but still meaningful for the under-25 audience.
- Facebook has not died. Its 80.6% reach makes it the dominant platform overall, and the 55-64 segment is its fastest-growing demographic.
- LinkedIn reports 18M registered members (+12.5% YoY), equal to ~85% of adults on paper, though that counts registered not active accounts. B2B advertising is still under-deployed.
For B2C, the practical move is the multi-platform stack: Facebook + Instagram + TikTok + Reddit. For B2B, it is LinkedIn + a small Reddit presence in the relevant subs. WhatsApp’s 52.2% penetration also opens conversational and chatbot-led engagement for the right verticals.
More context in our state of SEO and marketing in Australia report.
5. Streaming, Gaming & Content Consumption
- Video streaming: 91% of Australians streamed online video in 2024 (ACMA). YouTube, Netflix, Disney+, and Amazon lead these categories.
- Audio trends: Podcasts reach about 55% of Australians monthly in 2026, up from 48% in 2024 (Infinite Dial Australia). Spotify and Apple Music dominate.
- Gaming & e-sports: Not in existing sources; an opportunity: recommend collecting local insight here to fill the gap.
Streaming platforms are prime advertising venues; consider sponsorships and short-form ad formats. Podcasts offer intimate marketing options, think sponsorships or branded segments.
Analysis: The 91% streaming adoption rate signals the complete disruption of traditional media consumption in Australia.
- Traditional TV advertising is losing relevance. Streaming platforms now offer sophisticated targeting and demonstrably engaged audiences.
- Monthly podcast reach near 55% points to a highly engaged, often affluent demographic that consumes content during commutes, exercise and routine activities. Brands can integrate naturally into content here, without the skip-button threat of traditional digital ads.
- Gaming and e-sports data is missing from the official surveys. That is a real intelligence gap. The sector likely commands substantial engagement time and spending among younger demographics. Businesses entering this space early may capture audience attention before competition intensifies and advertising costs rise.
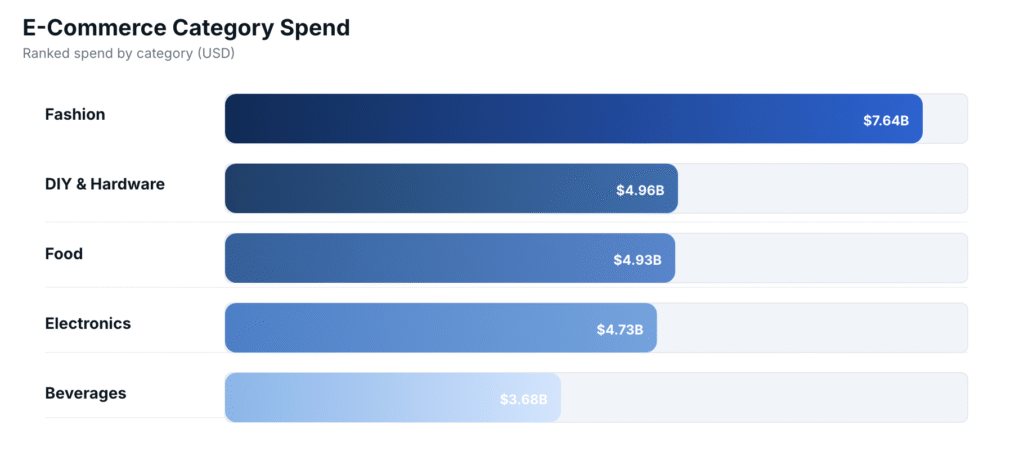
6. E-commerce deep dive (2026 update)
E-commerce snapshot
- 23.0 million online shoppers (+6.5% YoY)
- $39.4 billion USD annual online consumer goods spend (+13.2% YoY)
- 24.8% of all consumer goods retail sales now happen online (+9.3% YoY)
- 45.2% of e-commerce spend comes from mobile purchases
- Average annual revenue per online shopper: $1,708 USD (+5.9% YoY)
Source: Datareportal Digital 2026 / Meltwater 2026 / We Are Social.
On Australia Post’s broad measure, online sales reached 24.8% of consumer-goods retail, up about 9.3% year-on-year (Meltwater Digital 2026 Australia). This parcel-based measure runs well above the narrower ABS retail-trade definition (~15%), so treat it as one lens, not the whole picture.
Payment and device patterns
- Card payments: 61% of online purchases
- Digital wallets (Apple Pay, Google Pay): 23%
- Buy Now Pay Later: 11%
- Mobile purchase completion rate: 73%
What it means for AU businesses
The 2026 number resets the strategic conversation. AU e-commerce is no longer “lagging the US”; at 24.8% of consumer-goods retail it is comparable to most developed markets, with mobile driving 45% of the spend.
Three takeaways:
- Mobile checkout is now the conversion battlefield. Slow load times, clunky payment flows or missing digital-wallet support cost real revenue.
- BNPL is mature, not novel. 11% of AU shoppers use it; not offering it leaves money on the table in the right verticals (fashion, electronics, lifestyle).
- The 75% of retail still offline is the biggest remaining opportunity, particularly in automotive, professional services and high-consideration verticals where digital transformation has lagged.
7. Internet speeds and infrastructure (2026)
| Connection Type | Median Download |
|---|---|
| Fixed Broadband | ~164 Mbps |
| Mobile (5G era) | ~128 Mbps |
Source: Ookla Speedtest data via WorldPopulationReview, late 2025.
The 2026 picture: fixed broadband (median ~164 Mbps) runs comfortably ahead of mobile (~128 Mbps) in Australia, after NBN’s late-2025 tier upgrades lifted fixed speeds. Mobile has closed the gap as 5G matured, but has not overtaken fixed.
What changed
- 5G adoption is forecast around 60% of subscriptions in 2025, rising toward 70% in 2026
- 5G coverage now reaches roughly 91% of the population across the major networks (Telstra, Optus, TPG)
- Fixed broadband speeds rose sharply in late 2025 with NBN’s higher-tier upgrades
- Fixed connections remain low-latency, well suited to real-time applications
Why it matters for business
For regional Australian businesses, the 5G inversion changes what is feasible. Live streaming, video conferencing, real-time collaboration and bandwidth-intensive applications no longer require expensive fixed connections.
For metropolitan businesses, the speed gains have raised user expectations. A 3-second page load was acceptable in 2020; in 2026, with fast fixed and mobile broadband, users churn out of slow sites at much higher rates.
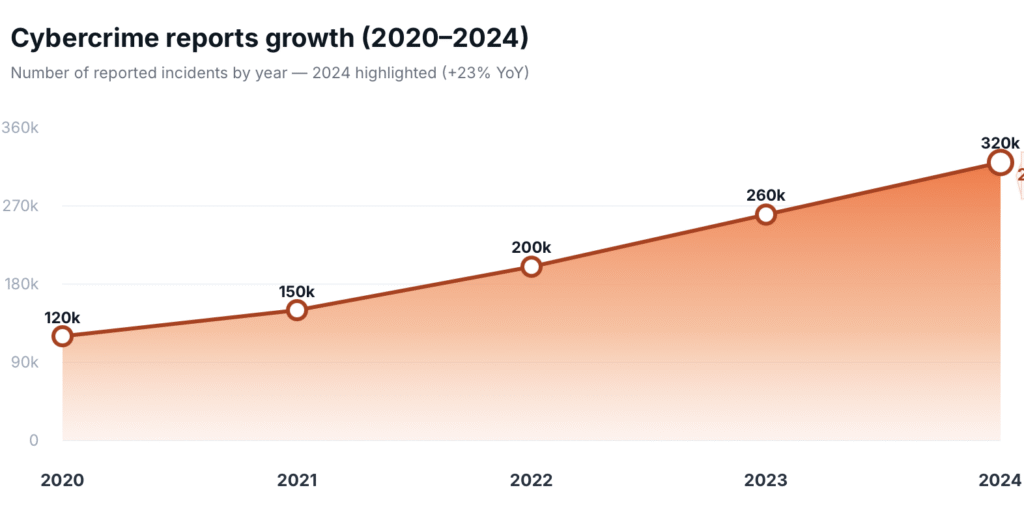
8. Cybersecurity & Privacy Climate
- Cybercrime reports, FY2023-24: about 87,400, down roughly 7% year-on-year (ASD Annual Cyber Threat Report); the FY2024-25 report puts it near 84,700
- Main threats: Phishing schemes, scams, identity theft
- Regulatory scope: The Privacy Act is being revised, expect changes in data rights and handling.
Strengthen your security protocols, especially in payments and customer data flow. Clear privacy communication is a must, both for trust and compliance.
Analysis: The ~87,400 reported cybercrimes represent only the visible portion of a much larger security picture, as many incidents go unreported or undetected. Reports dipped slightly year-on-year, but that reflects reporting behaviour as much as real risk: the losses per incident and the sophistication of scams targeting Australian consumers and businesses continue to rise.
The prevalence of phishing and identity theft suggests criminals are exploiting human psychology rather than purely technical vulnerabilities, making employee training and customer education critical security investments.
The Privacy Act revisions signal regulatory tightening that will likely mirror GDPR-style requirements. That creates compliance costs in the short term, but also competitive advantages for businesses that implement robust privacy practices early.
Companies that proactively address security concerns build trust that translates into customer loyalty and premium pricing power. Three things move the needle: transparent communication, strong technical safeguards, and clear data-handling policies.
9. Regional Diversity & State-Level Highlights
Metro vs Rural Gap: On the NBN fixed-line network, regional speeds now sit within about 2% of urban (ACCC Measuring Broadband Australia). The large gaps appear on fixed-wireless and satellite services in rural and remote areas, not on fixed-line NBN.
- NSW & VIC: top speeds, high e-commerce uptake
- TAS & NT: slower net speed, lower digital penetration
Tailor service experiences for slower networks, lightweight pages, offline features, and alternate communication options.
Analysis: The remaining speed differential, concentrated on fixed-wireless and satellite services in rural and remote areas, creates a two-tier digital economy that smart businesses can exploit through adaptive service delivery. Regional users often demonstrate higher loyalty and lower churn rates when businesses accommodate their technical constraints through optimised experiences.
This digital divide also creates opportunities for businesses to establish strong regional presences before competitors invest in these markets. The slower adoption in Tasmania and Northern Territory may reflect demographic factors, economic conditions, or infrastructure limitations, but also represents untapped markets with less competition.
Businesses that develop “network-conscious” products, featuring offline capabilities, progressive loading, and bandwidth-efficient designs, can serve both regional users effectively and create more resilient urban experiences that perform well during network congestion or outages.
10. Global benchmarking, Australia vs other regions (2026)
| Metric | Australia | OECD avg | UK / US |
|---|---|---|---|
| Internet penetration | 97.1% | ~85-90% | 92-97% |
| Fixed broadband download | ~164 Mbps | ~80-100 Mbps | ~120 Mbps (UK) |
| Mobile download | ~128 Mbps | ~70-90 Mbps | ~100 Mbps (US) |
| E-commerce share of retail (ABS basis) | ~15% | ~15-20% | ~16.9% (US) |
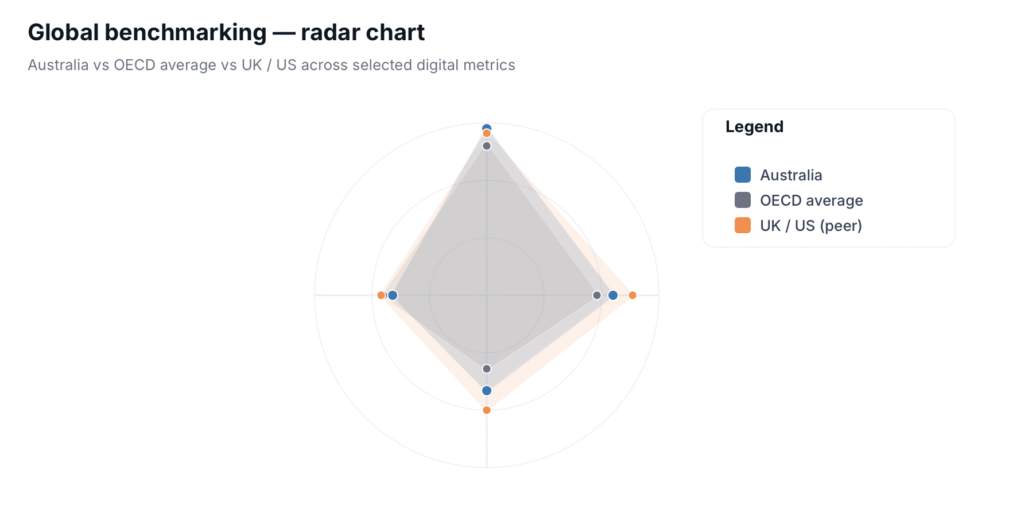
The 2026 picture has shifted in two important ways:
- Broadband speed: Australia’s fixed median (~164 Mbps) is competitive with, and on some readings ahead of, the US and UK; mobile (~128 Mbps) sits in the global upper tier.
- E-commerce penetration: on a like-for-like retail-trade basis (ABS), Australia sits near 15%, close to the US (~16.9% per the US Census Bureau). Australia Post’s broader parcel-based measure reports ~24.8%, but the two are not directly comparable, so Australia is roughly on par with the US, not dramatically ahead.
What this means in practice: Australian businesses are no longer competing in a market that is digitally less mature than the US or UK. The bar for site speed, mobile UX and payment flow is now the global standard, not a local-friendly version of it.
11. What It Means for Aussie Businesses
Australian businesses face a “digital maturity paradox”, high connectivity and adoption rates create enormous opportunities, but also mean competition is increasingly fierce and user expectations are rising rapidly. Success requires not just digital presence, but digital excellence across multiple channels, devices, and user contexts.
The window for gaining competitive advantage through basic digital adoption is closing; the future belongs to businesses that can deliver sophisticated, secure, and seamless digital experiences that rival global standards.
- Mobile is table stakes, optimize UX and performance
- Search strategy remains Google-first, allocate budgets accordingly
- Social platforms are split by age, TikTok for youth, Facebook for older demo
- Streaming and podcasts = potent channels, leverage short-form, brand-friendly formats
- Fast speeds mean high expectations, don’t skip optimization
- Security and privacy are not optional, they’re core trust and conversion drivers
- Regional differences matter, adapt experiences by location
12. FAQ
What percentage of Australians use the internet?
97.1% of the population (about 26.2 million people) are online at the start of 2026, per Datareportal Digital 2026 Australia.
Which social media platform is most used in Australia?
Facebook leads with 80.6% reach among social media users, followed by Messenger (68.0%), Instagram (65.9%) and YouTube (60.9%) per Meltwater 2026.
What is the average daily time Australians spend online?
About 5 hours 52 minutes per day (41h 3m per week), with mobile making up 51% of that time and desktop/laptop 42%.
How much do Australians spend online each year?
$39.4 billion USD in 2025 (DataReportal Digital 2026), up 13.2% YoY. Online sales account for about 24.8% of consumer-goods retail on Australia Post’s broad measure (nearer 15% on the ABS retail-trade basis).
Are Australian internet speeds fast?
Yes. Median fixed broadband (~164 Mbps) runs ahead of mobile (~128 Mbps) after NBN’s late-2025 upgrades, with 5G keeping mobile competitive. Australia sits in the global upper tier for both.
Sources:
- DataReportal – Digital 2026: Australia, digital population, mobile connections, social users, e-commerce.
- Meltwater – Social Media Statistics Australia, device access, time online, platform reach, e-commerce spend.
- StatCounter – Search Engine Market Share Australia (June 2026).
- ACMA – How we watch and listen to content (2024), 91% online video.
- Infinite Dial Australia, monthly podcast reach.
- Ookla Speedtest data via WorldPopulationReview, fixed and mobile speeds.
- GlobalData, 5G adoption forecast.
- ASD Annual Cyber Threat Report 2023–24, cybercrime reports.
- ACCC Measuring Broadband Australia, regional vs metro speeds.
- US Census Bureau – Quarterly E-commerce Report, US e-commerce share.