Proving Local SEO Success: The Power of Geo-Grid Rank Tracking
Last Updated on 12 March 2026 by Dorian Menard
TL;DR: Geo-grid rank tracking maps your Google Business Profile rankings across hundreds of GPS coordinates, revealing that rankings vary up to 47% within a single mile. 44% of local searchers click the Map Pack (vs 29% organic); 68% visit those businesses. Modern tools add demographic layers showing income, age, and density data on your ranking heatmap, transforming guesswork into strategy.
A Perth plumber ranks #1 in Subiaco. Type his business name into Google Maps from Joondalup, and he’s invisible. Traditional rank tracking shows him in position 3 city-wide. Reality? He’s losing $50,000 per year from the northern suburbs he thinks he’s dominating.

This isn’t a hypothetical. It’s the daily reality for local businesses relying on single-point rank tracking. Google doesn’t rank you the same way across your service area. Proximity algorithms, competitor density, and local signals create massive ranking variance street by street, suburb by suburb.
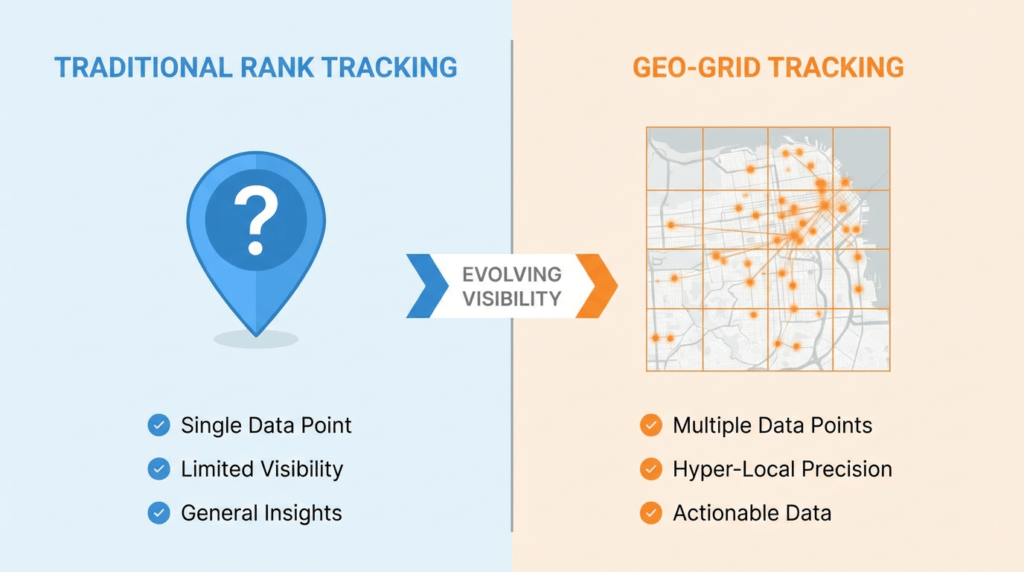
Geo-grid rank tracking solves this problem. It’s the difference between flying blind and having a detailed map of exactly where you’re visible and where you’re invisible.
What Is Geo-Grid Rank Tracking?
Geo-grid rank tracking measures your Google Business Profile ranking by simulating searches from hundreds of GPS coordinates across your service area, then visualizes the results as a color-coded heatmap showing exactly where you rank and where you don’t.
Here’s how it works. The tool divides your target area into a grid of coordinates (typically 100-400 points). It simulates a search for your target keywords from each point, records your ranking position, and generates a heatmap. Green zones show where you dominate. Yellow zones show where you’re visible but not dominant. Red zones show where you’re invisible.
The technology behind this is straightforward but powerful. Tools use Google’s own ranking algorithms, simulate real searches from specific GPS coordinates, and map the results. What you get is truth, not averages.
Why Traditional Rank Tracking Fails Local Businesses
Traditional rank tracking checks your position from a single point (usually your office address or city center). It gives you one number: “You rank #3 for emergency plumber Perth.”
That number is useless. Google’s local ranking algorithm changed fundamentally in December 2021, increasing the weight of proximity as a ranking factor. A searcher 500 meters from your location sees different results than someone 2 kilometers away.
Research shows rankings can vary by up to 47% within a single mile. If you serve a 10-mile radius, you’re not one ranking. You’re hundreds of different rankings across that area.
City-wide averages mask the truth. You might rank #1 in wealthy suburbs and #15 in working-class areas. You might dominate the north and be invisible in the south. Traditional tracking shows you an average. Geo-grid tracking shows you reality.
The Numbers That Matter

The stakes are massive:
- 44% of local searchers click the Map Pack, compared to only 29% clicking organic results
- 68% of consumers who find a business in the Map Pack visit or call within 24 hours
- 80% of all local searches happen on mobile devices
- 72% of consumers who perform a local search visit a store within five miles
- Businesses ranking in the top 3 Map Pack positions receive 126% more traffic and 93% more conversion-oriented actions than positions 4-10
The Map Pack is the game. If you’re not in the top 3, you’re invisible to 44% of your potential customers. Geo-grid tracking shows you exactly where you’re in the top 3 and where you’re not.
Demographic Layers: The Game-Changer
Top geo-grid tools let you overlay demographic data (median income, population density, median age) directly onto your ranking heatmap, revealing whether you’re visible to the customers who can actually afford your services or invisible in your ideal target markets.
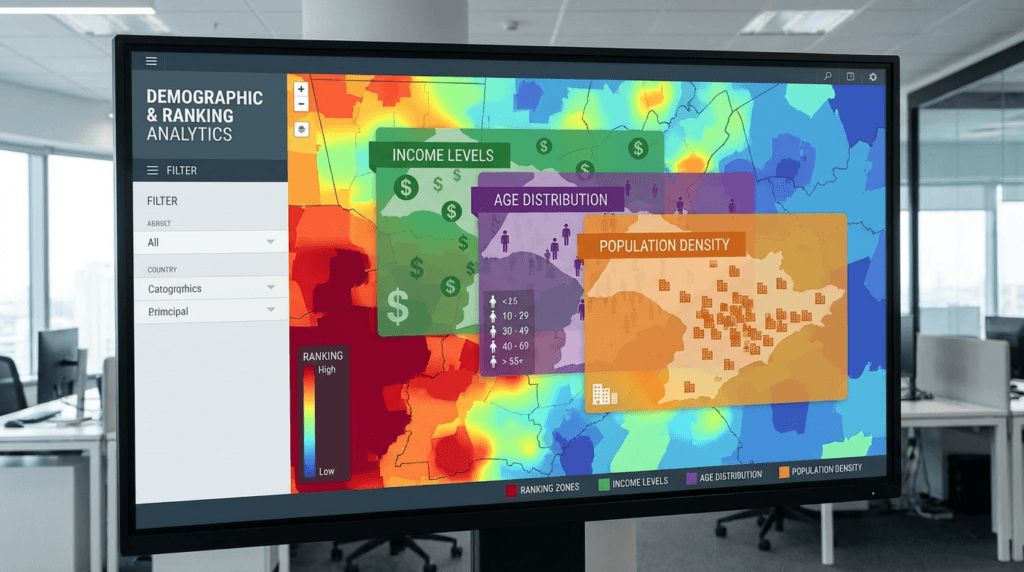
This is where geo-grid tracking becomes strategic intelligence, not just performance monitoring.
Imagine you’re a luxury home builder. Your geo-grid heatmap shows you rank #1 across most of Perth. Then you add the median income layer. Suddenly you see you dominate suburbs with $60K median incomes but you’re invisible in Peppermint Grove, Cottesloe, and Dalkeith, where median incomes exceed $150K.
That data changes everything. You now know your local SEO strategy needs to prioritize high-income suburbs, not broad coverage.
We use demographic layers every single day for client strategy. A client selling $8,000 HVAC systems doesn’t need visibility in student areas. They need visibility where homeowners can afford premium systems. Demographic overlays show us exactly where to focus GBP optimization, review generation, and local keyword research.
Top Geo-Grid Tools Compared
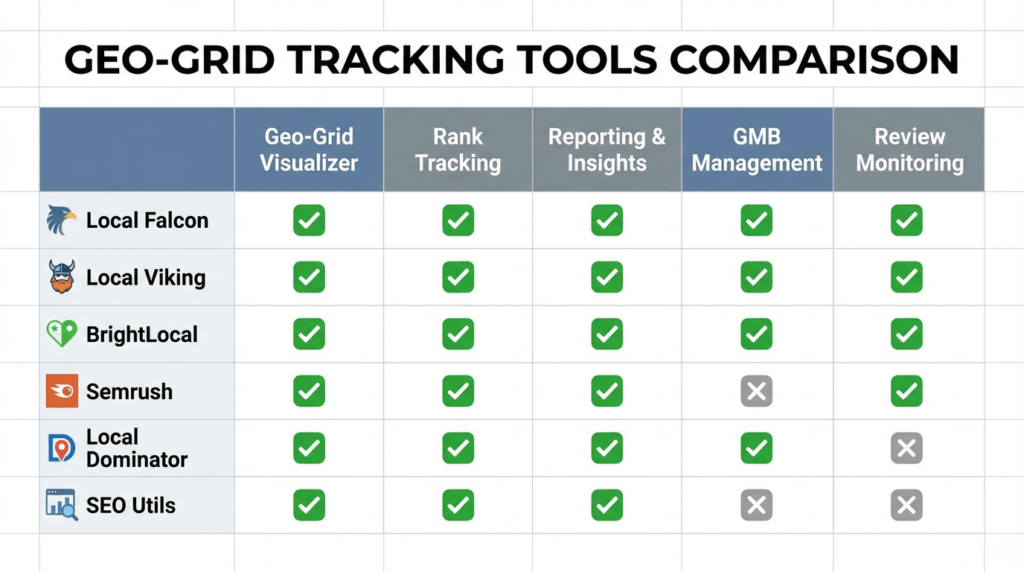
- Local Falcon remains the market leader for pure visualization. Their 21×21 grid provides the most detailed heatmaps available. Falcon AI tracks visibility in AI-powered answer engines (ChatGPT, Perplexity, Google AI Overviews), addressing the shift toward AI-powered GEO. They offer demographic layers, competitor tracking, and Falcon Guard for GBP suspension monitoring.
- Local Viking combines geo-grid tracking with Google Business Profile management tools. If you need posting, Q&A management, and review responses alongside rank tracking, Local Viking is a solid all-in-one option. Their heatmaps are accurate but less detailed than Local Falcon’s.
- BrightLocal’s Local Search Grid integrates with their broader local SEO platform. If you already use BrightLocal for citation management and review monitoring, their geo-grid tool fits seamlessly into your workflow.
- Semrush Map Rank Tracker suits teams already invested in the Semrush ecosystem. It provides solid geo-grid functionality with the advantage of integrating directly into Semrush’s broader SEO toolkit.
- Local Dominator separates Local Pack rankings (prominence-based) from Google Maps rankings (proximity-based), giving you a clearer picture of why you rank where you rank.
- SEO Utils with Ringtonic App integration adds call tracking to geo-grid data. You can see not just where you rank, but which suburbs generate actual phone calls. This closes the loop between visibility and revenue, proving ROI with hard call data rather than ranking metrics alone.
How to Read Your Heatmap
- Green zones show where you rank in the top 3. This is where you’re winning. These areas generate traffic, calls, and revenue. Your job is to protect these positions and expand outward.
- Yellow zones show where you rank positions 4-10. You’re visible but not dominant. These are your opportunity zones. Small optimization improvements (more reviews, better GBP categories, suburb-specific content) can push you into the green.
- Red zones show where you’re invisible (ranking below position 10). These areas represent lost revenue. If they’re high-value suburbs (use demographic overlays to check), they’re your immediate priorities.
Pay attention to proximity drop-off patterns. If you rank #1 within 2 kilometers of your location but fall to #8 at 5 kilometers, you have a proximity problem. The solution is building relevance in distant suburbs through suburb-specific landing pages, local backlinks, and targeted review generation in those areas.
Real Results
We’ve generated over $3.5 million in client revenue by using geo-grid tracking to identify and fix visibility gaps.
One Perth electrician came to us ranking well in Subiaco and Nedlands but invisible in Joondalup and Ellenbrook. Geo-grid data showed the gap. We built suburb-specific landing pages, generated reviews from customers in those areas, and secured local backlinks from northern suburbs. Six months later, his coverage expanded from 30% to 75% of his target area. Revenue increased by $180,000 per year.
A cosmetic dentist in Applecross had strong rankings within 3 kilometers but fell off a cliff beyond that. Geo-grid tracking revealed the proximity problem. We added suburb-specific service pages, optimized her Google Business Profile categories, and built local citations. Her calls from distant suburbs tripled within four months.
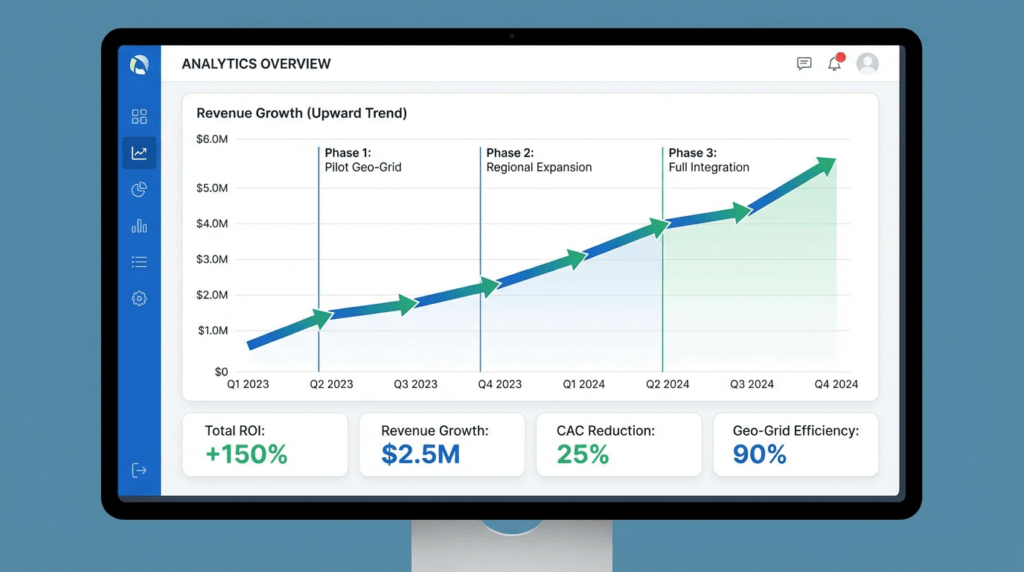
Research shows 40% of local SEO campaigns achieve 500%+ ROI. Geo-grid tracking is how you get there. It tells you where to focus resources for maximum impact.
The Bottom Line
Traditional rank tracking gives you averages. Geo-grid tracking gives you truth.
If you serve multiple suburbs, you need geo-grid tracking. If your customers come from a 5+ mile radius, you need geo-grid tracking. If you’re investing in lead generation and can’t explain why some areas convert while others don’t, you need geo-grid tracking.
The tools exist. The data is accurate. The results are measurable.
We offer free geo-grid audits for Perth businesses. We’ll map your current visibility, identify your biggest gaps, and show you exactly where you’re losing revenue. No fluff, no sales pitch. Just data.
Book your audit here.
Frequently Asked Questions
How often should I run geo-grid scans?
Run scans weekly for active optimization campaigns and monthly for maintenance. If you’re making significant GBP changes (new categories, service updates, aggressive review generation), scan weekly to measure impact. For stable businesses maintaining existing rankings, monthly scans catch any unexpected drops before they cost you revenue.
What’s a good coverage percentage to target?
Target 60-75% green coverage across your service area. 100% coverage is unrealistic and unnecessary. Focus on dominating high-value suburbs (use demographic overlays to identify them) rather than chasing universal visibility. A luxury service provider with 50% coverage in wealthy suburbs will outperform a budget provider with 80% coverage in low-income areas.
Do I need geo-grid tracking if I only serve one suburb?
Yes, if that suburb covers more than 2 square kilometers. Even within a single suburb, rankings vary by proximity to your location and competitor density. Geo-grid tracking shows you where in your suburb you’re strong and where you need improvement.
How do demographic layers affect my strategy?
Demographic layers tell you whether you’re visible to customers who can afford your services. If you’re a premium provider ranking #1 in low-income areas but invisible in high-income suburbs, you’re optimizing for the wrong audience. Demographic data guides where to focus GBP optimization, content creation, and local link building.
Can I track competitors with geo-grid tools?
Yes. Most tools (Local Falcon, Local Viking, BrightLocal) let you add competitor profiles and see their heatmaps alongside yours. This reveals where they dominate, where you dominate, and where neither of you have strong coverage (opportunity zones). Competitor tracking shows you exactly what you need to beat to expand coverage.

Dorian Menard
https://searchscope.com.auI’m Dorian, founder of Search Scope and an SEO obsessed with ROI and lead generation. After a decade in the trenches, I’ve built and ranked digital assets for businesses across the world. I cut through the noise with data, automation, and strategies that actually convert. When I’m not scaling rankings, you’ll find me on a motorbike or setting chess traps — always planning three moves ahead.