Australian Internet Statistics 2025 – Deep Dive Report
Last Updated on 19 August 2025 by Dorian Menard
Australia in 2025 has reached near-universal internet adoption, with 97.1% of the population online and mobile connections exceeding the national headcount. This transformation reflects more than just connectivity — it reshapes how Australians work, shop, communicate, and secure their digital lives.
From mobile-first habits and faster broadband speeds to the rise of e-commerce, dominance of streaming platforms, and increasing cybersecurity risks, the nation is now firmly embedded in a digital economy.
This report goes beyond raw numbers. It provides context, commentary, and actionable insights for business leaders, marketers, and policymakers who need to understand not just where Australia stands today, but how these shifts create both opportunities and challenges.
Whether you are benchmarking against global peers, planning marketing campaigns, or exploring infrastructure investment, this deep dive into Australian internet statistics is designed to be your most authoritative and up-to-date guide in 2025.
1. Digital Population & Five-Year Trends
| Year | Population | Internet Users | % Penetration | Social Media Users | Mobile Connections |
|---|---|---|---|---|---|
| 2019 | 25.3 M | 20.0 M | 79% | 16 M | 24 M (95%) |
| 2022 | 26.0 M | 24.5 M | 94% | 19.8 M | 29 M (112%) |
| 2025 | 26.88 M | 26.10 M | 97.1% | 21.3 M | 31.4 M (117%) |

Why it matters:
- Internet users have grown steadily, reaching near total saturation by 2025.
- Mobile connections now exceed population, indicating heavy multi-device use.
- Social media adoption continues rising, a critical channel for market access.
The progression from 79% to 97.1% internet penetration over six years represents one of the most comprehensive digital transformations in Australia’s history. This saturation point signals a fundamental shift in the market landscape—businesses can no longer differentiate themselves simply by having an online presence.
The 117% mobile connection rate reveals a multi-device ecosystem where consumers seamlessly switch between smartphones, tablets, and secondary devices throughout their day. This behaviour pattern demands sophisticated cross-device tracking and attribution models for accurate marketing measurement.
The remaining 2.9% offline population likely represents remote communities, elderly demographics, or conscientious digital abstainers—a niche that may require alternative engagement strategies.
2. Device Usage & Connection Landscape

Device Access Share:
- Mobile phones: 94.9%
- Laptops/desktops: 82%
- Tablets: 45%
Average Daily Screen Time:
- Total: 6h 05m
- Mobile: 2h 58m
- Computers/tablets: 3h 07m
Broadband Access:
Australia saw FTTP (fibre-to-the-premises) overtake older tech like FTTN and HFC by mid-2024 thanks to NBN upgrades.
Design mobile-first experiences. Australians are spending nearly 3 hours per day on their phones — your platform must deliver speed and seamless mobile UX.
Analysis: The near-parity between mobile (2h 58m) and desktop/tablet usage (3h 07m) reveals a sophisticated digital behaviour where Australians consciously choose different devices for different tasks. This suggests mobile devices dominate for quick interactions, social browsing, and immediate needs, while desktop/tablet time likely concentrates on work, detailed research, and complex transactions.
The 45% tablet adoption rate, while seemingly modest, represents a significant secondary screen opportunity often overlooked by marketers. These devices frequently serve as evening entertainment hubs and weekend browsing companions, presenting unique targeting windows.
The FTTP infrastructure upgrade creates a technical foundation for bandwidth-intensive applications like AR/VR, 4K streaming, and real-time collaboration tools—early adopters in these spaces may gain competitive advantages. Internet speed is on the rise globally in Australia.
3. Search Behaviour & SEO Context
Search Engine Market Share (August 2025):
- Google: 91.72%
- Bing: 5.68%
- DuckDuckGo: 1.27%
- Yahoo!: 0.82%
SEO in Australia is almost synonymous with Google. Paid search budgets should mirror this dominance, yet lesser platforms like DuckDuckGo are slowly rising as privacy concerns grow.
Analysis: Google’s 91.72% market share represents both an opportunity and a vulnerability for Australian businesses. This concentration means mastering Google’s algorithm updates, local search factors, and mobile-first indexing is non-negotiable for organic visibility.
However, DuckDuckGo’s 1.27% share, while small, represents approximately 330,000 privacy-conscious users—a potentially valuable demographic for businesses in finance, health, legal, or premium services.
Bing’s 5.68% share (roughly 1.5 million users) often delivers higher conversion rates due to different user demographics and less competition. Smart SEO strategies should maintain Google focus while testing alternative search engines for niche market penetration, particularly as privacy regulations tighten and search behaviour potentially fragments. Bing is particularly attractive for B2B, tech niches and to pull ChatGPT traffic.
More on search engine usage in Australia.
4. Social Media Dynamics & Platform Shifts
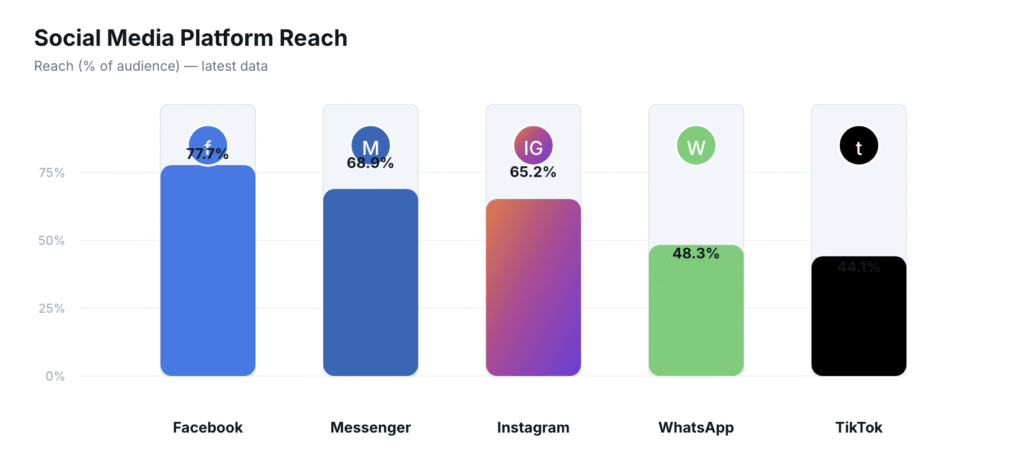
Platform Reach (Monthly Active Users):
- Facebook: 77.7%
- Messenger: 68.9%
- Instagram: 65.2%
- WhatsApp: 48.3%
- TikTok: 44.1%
Demographic Inflection:
- TikTok is surging fastest in the 18–24 bracket.
- Facebook’s growth is now strongest in the 55–64 segment — a nod to evolving habits.
Engagement Tips:
- Use Reels and short-form content for TikTok/Instagram.
- Facebook remains essential for “mass” reach and older demos.
Analysis: The platform hierarchy reveals a generational digital divide that’s reshaping marketing strategies across Australia. Facebook’s dominance among older demographics (55-64) transforms it from a youth platform into a mature audience channel, perfect for financial services, healthcare, and premium products targeting established consumers.
Meanwhile, TikTok’s 44.1% reach among younger demographics creates a parallel marketing universe with entirely different content expectations, attention spans, and conversion pathways.
The 68.9% Messenger adoption rate suggests Australians prefer private, direct communication over public social interaction—indicating strong potential for conversational marketing, chatbot engagement, and personalised customer service. WhatsApp’s 48.3% penetration creates opportunities for international businesses or those serving multicultural communities where the platform dominates global communication.
More on the state of SEO and marketing in Australia.
5. Streaming, Gaming & Content Consumption
- Video streaming: 91% of Australians streamed video content in 2024. YouTube, Netflix, Disney+, and Amazon lead these categories.
- Audio trends: Podcasts reach 42% of Australians monthly. Spotify and Apple Music dominate.
- Gaming & e-sports: Not in existing sources; an opportunity: recommend collecting local insight here to fill the gap.
Streaming platforms are prime advertising venues; consider sponsorships and short-form ad formats. Podcasts offer intimate marketing options — think sponsorships or branded segments.
Analysis: The 91% streaming adoption rate signals the complete disruption of traditional media consumption patterns in Australia. This shift creates both challenges and opportunities—traditional TV advertising loses relevance while streaming platforms offer sophisticated targeting capabilities and engaged audiences. The 42% podcast listenership represents a highly engaged, often affluent demographic that consumes content during commutes, exercise, and routine activities.
This creates unique advertising opportunities where brands can integrate naturally into content without the skip-button threat of traditional digital ads. The missing gaming and e-sports data represents a significant intelligence gap, as this sector likely commands substantial engagement time and spending among younger demographics. Businesses entering this space early may capture audience attention before competition intensifies and advertising costs rise.
6. E-Commerce Deep Dive
E-Commerce Snapshot:
- Online shoppers: 17.1 M
- Annual spend: $37.1 B AUD (+3% YoY)
- Online share of retail goods: 13.8% (+6.4%)
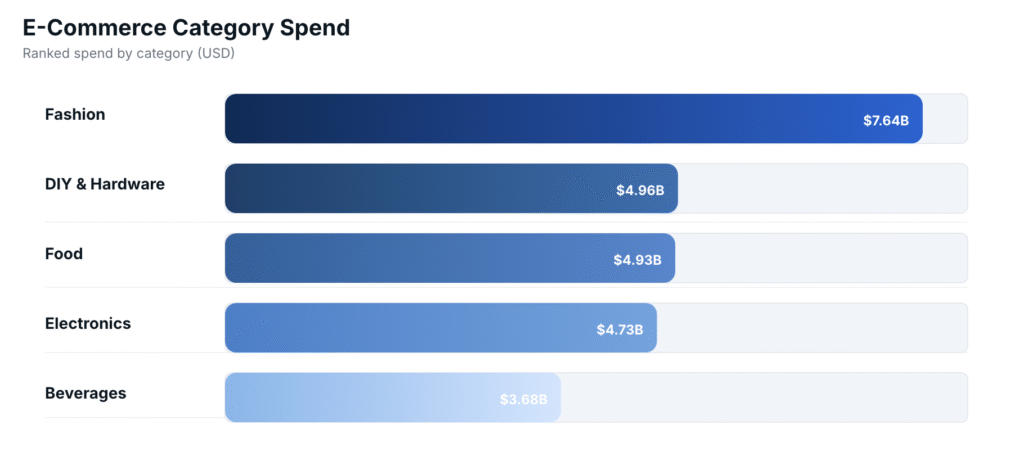
Top Categories (by spend):
- Fashion – $7.64 B
- DIY & Hardware – $4.96 B
- Food – $4.93 B
- Electronics – $4.73 B
- Beverages – $3.68 B
Potential Gaps to Explore:
- Average order value and growth trends
- Device/utilisation breakdown (mobile vs desktop purchases)
- Payment preferences: Buy Now Pay Later (BNPL), PayPal, card
Optimize your checkout for mobile, tap into rising categories (DIY and food), and consider offering flexible payments.
Analysis: The $37.1 billion online spend with only 13.8% retail share reveals enormous untapped potential in Australian e-commerce SEO. This relatively low penetration compared to markets like the UK (18%) or US suggests either significant growth runway or structural barriers preventing online adoption in certain categories.
The dominance of Fashion ($7.64B) reflects Australia’s style-conscious culture and the category’s suitability for online browsing and social commerce. However, DIY & Hardware’s $4.96B performance indicates Australians increasingly trust online platforms for complex purchases requiring product research and comparison.
Food’s $4.93B spend likely accelerated during COVID-19 restrictions and maintained momentum through convenience and delivery service improvements. The growth opportunity lies in converting the remaining 86.2% of retail spending, particularly in categories like automotive, healthcare, and professional services where digital transformation lags.
7. Internet Speeds & Infrastructure
| Connection Type | Median Download | Median Upload |
|---|---|---|
| Fixed Broadband | 103.46 Mbps | 21.87 Mbps |
| Mobile | 77.90 Mbps | 13.65 Mbps |
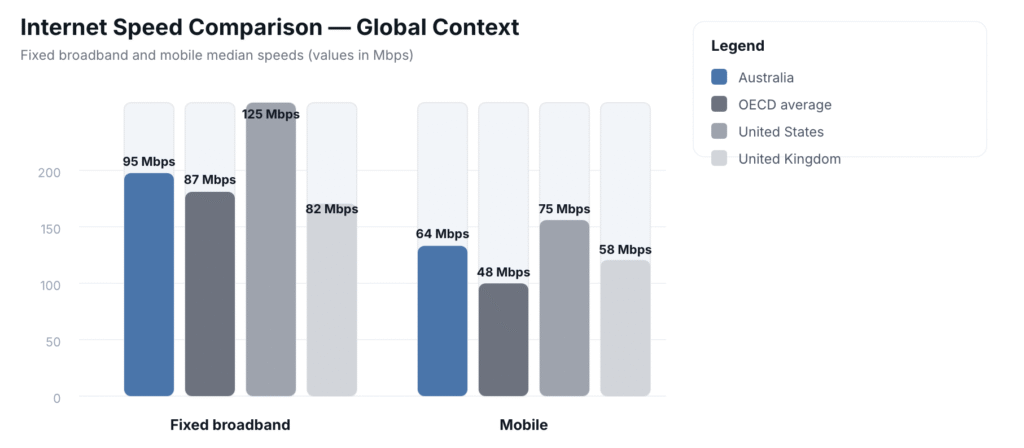
Global Comparison: These figures place Australia in the top 25 globally for fixed broadband speeds, though countries like Singapore and South Korea still lead.
With good speeds now standard, users expect fast page loads and optimized media; slow experiences risk losing traffic.
Analysis: The 103.46 Mbps fixed broadband median represents a quantum leap from Australia’s historically poor internet reputation, fundamentally changing user expectations and business possibilities. This speed enables seamless 4K streaming, video conferencing, and cloud-based applications that were previously impractical. However, the 21.87 Mbps upload speed creates an asymmetric capability that may limit content creation, video calling quality, and cloud backup services.
Mobile speeds at 77.90 Mbps approach fixed broadband performance, suggesting 5G deployment is creating genuine wireless alternatives to traditional connections. This infrastructure improvement levels the playing field for regional businesses and enables remote work capabilities that reshape employment and service delivery models.
Businesses can now implement bandwidth-intensive features like live streaming, virtual reality experiences, and real-time collaboration tools without alienating users through poor performance.
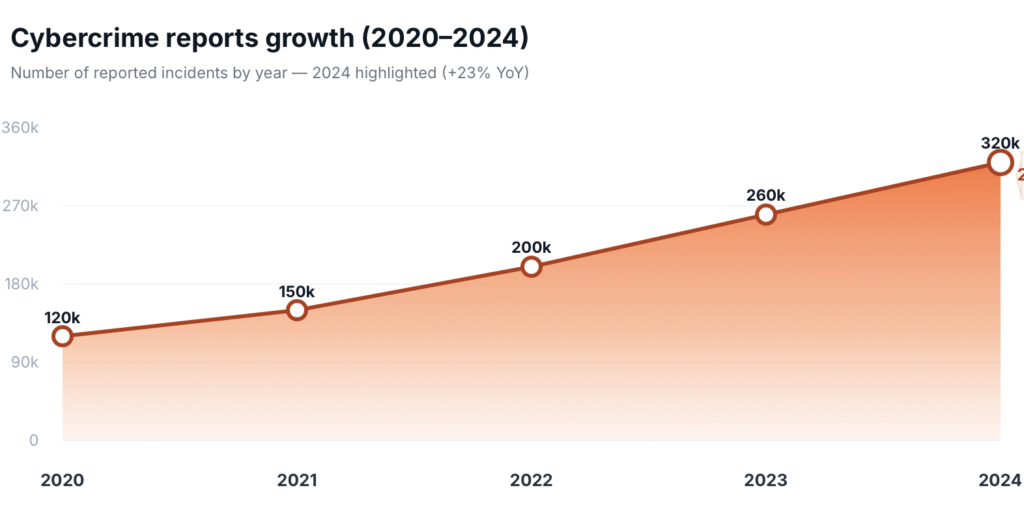
8. Cybersecurity & Privacy Climate
- Reported cybercrime incidents in 2024: 94,000+, a 23% increase year-on-year
- Main threats: Phishing schemes, scams, identity theft
- Regulatory scope: The Privacy Act is being revised — expect changes in data rights and handling.
Strengthen your security protocols, especially in payments and customer data flow. Clear privacy communication is a must — both for trust and compliance.
Analysis: The 94,000+ reported cybercrime incidents represent only the visible portion of a much larger security crisis, as many breaches go unreported or undetected. This 23% year-on-year increase correlates with increased digital adoption but also reveals sophisticated criminal operations targeting Australian consumers and businesses.
The prevalence of phishing and identity theft suggests criminals are exploiting human psychology rather than purely technical vulnerabilities, making employee training and customer education critical security investments.
The Privacy Act revisions signal regulatory tightening that will likely mirror GDPR-style requirements, creating compliance costs but also competitive advantages for businesses that implement robust privacy practices early. Companies that proactively address security concerns through transparent communication, strong technical safeguards, and clear data handling policies will build trust that translates into customer loyalty and premium pricing power.
9. Regional Diversity & State-Level Highlights
Metro vs Rural Gap: Regional areas (e.g., regional WA, NT) have median speeds up to 30% slower than urban centres.
- NSW & VIC: top speeds, high e-commerce uptake
- TAS & NT: slower net speed, lower digital penetration
Tailor service experiences for slower networks — lightweight pages, offline features, and alternate communication options.
Analysis: The 30% speed differential between metropolitan and regional areas creates a two-tier digital economy that smart businesses can exploit through adaptive service delivery. Regional users often demonstrate higher loyalty and lower churn rates when businesses accommodate their technical constraints through optimised experiences.
This digital divide also creates opportunities for businesses to establish strong regional presences before competitors invest in these markets. The slower adoption in Tasmania and Northern Territory may reflect demographic factors, economic conditions, or infrastructure limitations, but also represents untapped markets with less competition.
Businesses that develop “network-conscious” products—featuring offline capabilities, progressive loading, and bandwidth-efficient designs—can serve both regional users effectively and create more resilient urban experiences that perform well during network congestion or outages.
10. Global Benchmarking – Australia vs Other Regions
| Metric | Australia | OECD Avg | UK / US |
|---|---|---|---|
| Internet Penetration | 97.1% | ~85–90% | 92–97% |
| Fixed Broadband Speed | 103 Mbps | ~80–100 Mbps | ~120 Mbps (UK) |
| Mobile Speed | 78 Mbps | ~50–70 Mbps | ~100 Mbps (US) |
| E-Commerce Penetration | 13.8% retail | ~15–20% | ~18% (US) |

- Internet: AUS 97.1% • OECD ~87.5% • UK/US ~94.5%
- Fixed: AUS 103 Mbps • OECD ~90 Mbps • UK/US ~120 Mbps
- Mobile: AUS 78 Mbps • OECD ~60 Mbps • UK/US ~100 Mbps
- E‑commerce: AUS 13.8% • OECD ~17.5% • US ~18%
Australia is comfortably above OECD norms in many areas, but still lags marginally behind developed peers like the UK/US in some speed and e-commerce measures.
Analysis: Australia’s positioning slightly above OECD averages but below leading developed nations reveals a country in digital transition rather than digital leadership. The 97.1% internet penetration exceeding many developed markets demonstrates successful infrastructure investment and adoption policies, creating a foundation for economic growth.
However, the 13.8% e-commerce penetration lagging behind the US (18%) suggests cultural, regulatory, or structural barriers preventing full digital commerce adoption. This gap represents both a competitive threat—as international businesses may find Australian markets less digitally mature—and an opportunity for domestic businesses to capture market share before international competitors establish strong positions.
The mobile speed deficit compared to the US (78 vs 100 Mbps) may reflect geographic challenges and infrastructure costs, but could limit Australia’s competitiveness in mobile-first applications and services that require high bandwidth.
11. What It Means for Aussie Businesses
Australian businesses face a “digital maturity paradox”—high connectivity and adoption rates create enormous opportunities, but also mean competition is increasingly fierce and user expectations are rising rapidly. Success requires not just digital presence, but digital excellence across multiple channels, devices, and user contexts.
The window for gaining competitive advantage through basic digital adoption is closing; the future belongs to businesses that can deliver sophisticated, secure, and seamless digital experiences that rival global standards.
- Mobile is table stakes — optimize UX and performance
- Search strategy remains Google-first — allocate budgets accordingly
- Social platforms are split by age — TikTok for youth, Facebook for older demo
- Streaming and podcasts = potent channels — leverage short-form, brand-friendly formats
- Fast speeds mean high expectations — don’t skip optimization
- Security and privacy are not optional — they’re core trust and conversion drivers
- Regional differences matter — adapt experiences by location
12. FAQ
Q: What percentage of Australians use the internet?
A: In 2025, 97.1% of the population (about 26.10 M people) are online.
Q: Which social media platform is most used in Australia?
A: Facebook leads with 77.7% monthly active user reach, closely followed by Instagram and Messenger.
Q: What’s the average daily time Australians spend online?
A: Roughly 6 hours 5 minutes per day — split between mobile (2h 58m) and desktop/tablet (3h 7m).
Q: How much do Australians spend online each year?
A: In 2024, total online consumer goods expenditure hit AUD 37.1 billion.
Q: Are Australian internet speeds fast?
A: Median fixed line speeds are 103 Mbps, placing Australia in the global top 25, though behind leaders like Singapore.
Sources:
DataReportal – Digital 2025: Australia report (digital population, device usage, time online, e-commerce)
https://datareportal.com/reports/digital-2025-australia
Meltwater – Social Media Statistics Australia 2025 (platform reach)
https://www.meltwater.com/en/blog/social-media-statistics-australia
StatCounter – Search Engine Market Share Australia (July 2025)
https://gs.statcounter.com/search-engine-market-share/all/australia
ACMA – Media and communications trends (includes 91% online video usage, 2024)
https://www.acma.gov.au/articles/2024-12/acma-research-reveals-media-and-communications-trends
WorldPopulationReview – Internet speeds by country (global comparison baseline)
https://worldpopulationreview.com/country-rankings/internet-speeds-by-country
Ookla Speedtest Global Index – Australia detail (for monthly speed verification)
https://www.speedtest.net/global-index
ACSC Annual Cyber Threat Report 2023–24 (cybercrime incidents)
https://www.cyber.gov.au/about-us/view-all-content/reports-and-statistics/annual-cyber-threat-report-2023-2024

Dorian Menard
https://searchscope.com.auI’m Dorian, founder of Search Scope and an SEO obsessed with ROI and lead generation. After a decade in the trenches, I’ve built and ranked digital assets for businesses across the world. I cut through the noise with data, automation, and strategies that actually convert. When I’m not scaling rankings, you’ll find me on a motorbike or setting chess traps — always planning three moves ahead.