What Is Geo-Grid Rank Tracking?
Last Updated on 12 January 2026 by Dorian Menard
Geo-grid rank tracking is a visual way to see how your business ranks on Google Maps and in local search results from different customer locations. It places a virtual grid over your city or service area, with each point on the grid showing your exact ranking as if a search was performed from that spot.
As the founder of Search Scope, a Perth-based SEO agency, I rely on this data to show clients exactly where they are visible and where their competitors are winning.
It’s the most effective method for understanding your true local search performance. It moves beyond a single, misleading ranking number and gives you a real-world map of your visibility.
This guide explains what geo-grid rank tracking is, how it works, and how you can use the data to get more customers for your Australian business.
Here’s what you need to know:
- What It Is: A system that checks your Google ranking from multiple specific points in a geographic area.
- Why It Matters: It shows how your visibility changes street by street, helping you find weak spots and opportunities.
- How It Helps: The data allows you to make targeted improvements to your Local SEO rankings and Google Business Profile.
- Key Tools: Software like Local Falcon and BrightLocal are commonly used to generate these ranking maps.
What Is Geo-Grid Rank Tracking, Exactly?
Geo-grid rank tracking is a specialised tool for local SEO that shows you how your business ranks in Google search results across many different physical locations.
Instead of giving you a single ranking for a keyword like “plumber Sydney,” it creates a detailed heatmap. This map reveals that you might be #1 when someone searches from a block away, but drop to #9 just two kilometres across town.
This level of detail became essential after Google’s “Vicinity” update in late 2021, which heavily increased the importance of a searcher’s proximity to a business. A report from BrightLocal confirmed that 60% of consumers use Google Maps to find local business information, making this hyperlocal visibility critical.
How Does Geo-Grid Rank Tracking Work?
Geo-grid rank tracking helps you monitor your Google Maps rankings by breaking your service area into a grid. Each point in the grid acts like a virtual searcher, giving you a precise view of your ranking at that exact spot.
The Grid System Explained
The system lays a network of checkpoints over your target area. If you’re a cafe in the Perth CBD, you might set checkpoints every 200 metres to see how your visibility changes for searches like “coffee near me.”
This setup shows how your digital presence shifts across different parts of the city, guiding your local SEO efforts.
The process is straightforward:
- Grid Creation: You define your service area and the distance between each virtual checkpoint.
- Data Collection: The tool performs a Google search from each checkpoint and records your business’s rank.
- Visualisation: This data is plotted onto a colour-coded map, usually with green for high ranks and red for low ranks, making it easy to see patterns.
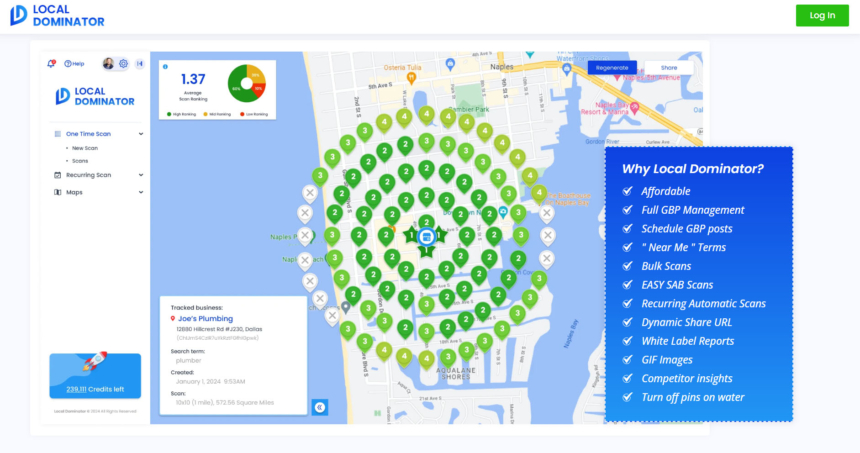 One popular tool on the market is Local Dominator from BrightLocal, which visualises this data clearly.
What Are the Main Grid Tracking Elements?
Geo-grid tracking uses three core elements to generate precise local ranking data.
Grid Size and Density
A tighter grid with points closer together (e.g., 200-500m spacing) gives you more granular detail, perfect for dense urban areas. For suburban businesses, a 1-5 km radius with wider spacing is often sufficient.
Search Parameters
The tracking is based on specific keywords you want to rank for, such as:
- Your business name
- Primary keywords (“emergency plumber”)
- Secondary keywords (“leaking tap repair”)
- Location-based keywords (“plumber in Joondalup”)
Ranking Data Points
Each checkpoint collects key metrics, including:
- Your position in the Google “local pack” (the top 3 map results)
- Your rank in the organic search results
- The distance of the search point from your business address
- The rankings of your top local competitors
| Grid Element | Purpose | Typical Setting |
|---|---|---|
| Grid Density | Determines the level of detail in your tracking. | 200m (CBD) to 1km (Suburbs) |
| Coverage Area | Defines the total area you want to monitor. | 1-10 km radius |
| Data Points | The number of checkpoints in your grid. | 25-100+ points |
How Does Grid Tracking Impact Local SEO?
Using geo-grid data allows you to move from guessing to making informed decisions. It directly shows you where your local SEO strategy is working and where it’s failing.
Can It Improve My Local Search Rankings?
Absolutely. By analysing the ranking heatmaps, you can pinpoint specific suburbs or neighbourhoods where your visibility is poor. This allows you to focus your efforts where they’ll have the most impact.
For instance, if your plumbing business in Sydney ranks well in the CBD but drops off sharply in Parramatta, you know exactly where to focus. You can then create a location-specific landing page for “Parramatta Plumbers,” run targeted ads, and gather customer reviews from that area.
A 2023 study by ReviewTrackers found that businesses that respond to reviews earn up to 49% more revenue. Geo-grid data can show you which areas to target for new reviews to boost rankings in those specific zones.
How Does It Help With Multiple Locations?
For franchises or businesses with several branches, geo-grid tracking is invaluable. It helps you ensure consistent visibility and prevents “keyword cannibalisation,” where your own locations compete against each other in search results.
Here are a few tips for multi-location businesses:
- Set a Unique Grid for Each Location: Don’t use a one-size-fits-all approach. A store in a dense city centre needs a tighter grid than a suburban one.
- Monitor for Overlap: Check if two of your locations are ranking poorly in the area between them. This could signal an opportunity for a targeted marketing campaign in that “dead zone.”
- Customise Content: Use the data to create localised content for each branch, mentioning nearby landmarks or local events.
| Location Type | Optimal Grid Density | Recommended Coverage Radius |
|---|---|---|
| CBD Location | 200-300m | 2-3 km |
| Suburban Shop | 500m | 3-5 km |
| Regional Store | 1 km | 5-10 km |
What Can I Learn About My Competitors?
Grid tracking isn’t just about your rankings; it’s a powerful competitive intelligence tool. Most geo-grid software allows you to track your top competitors on the same map.
This helps you:
- Identify Competitor Strongholds: See exactly where their visibility is highest and analyse what they’re doing right in those areas.
- Spot Market Gaps: Find neighbourhoods where both you and your main competitors are ranking poorly. This could be an untapped market for you to target.
- Benchmark Your Performance: Objectively measure your visibility against others instead of relying on guesswork.
How to Use Geo-Grid Rank Tracking: A Step-by-Step Guide
Step 1: Setting Up Your Grid
First, you need to define the area you want to track. Start by pinpointing your primary service area on a map.
- Choose Your Location: Enter your business address into the tool.
- Select Grid Size and Density: Use a detailed grid (e.g., 9×9) for dense urban areas and a broader one (e.g., 5×5) for regional locations.
- Enter Your Keywords: Set up the local search terms you want to track, like “electrician near me” or “best cafe in Fremantle.”
Once your grid is configured, the tool will collect the data and generate your first report.
Step 2: How to Read the Grid Data
Understanding the data is key to improving your local SEO strategy. The output is usually a heatmap where each point shows your ranking number.
Look for these key things:
- The “Green Zone”: These are the areas, typically close to your physical address, where you rank in the top 3. This is your stronghold.
- The “Yellow and Orange Zones”: Here, you’re on the first page of Google but not at the top (ranks 4-10). These are areas with high potential for improvement.
- The “Red Zone”: These are areas where you have little to no visibility (rank 11+). These are your weakest spots.
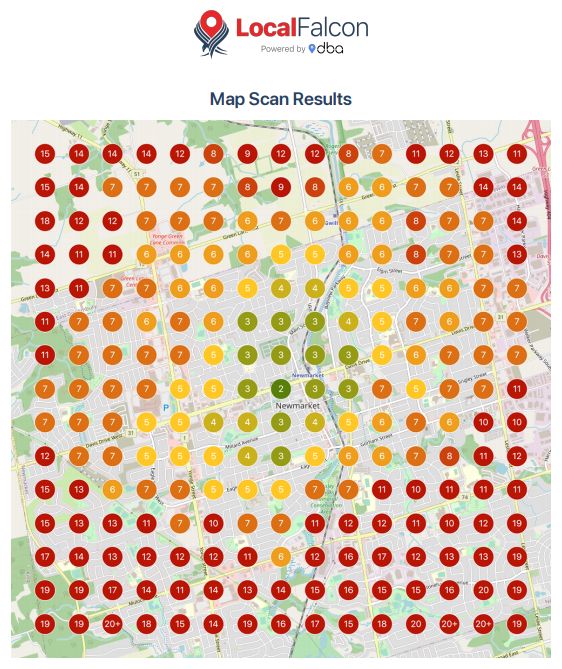 Our tool of choice, Local Falcon, is excellent for advanced geo-grid monitoring and shows these zones clearly.
How Do I Improve Local SEO with Grid Data?
Targeting the Right Keywords and Areas
Start by focusing on keywords that show strong commercial intent and target the suburbs where you want to grow.
For urban areas, set grid segments of 500m to 1km. In regional zones, you can expand this to 2-5km.
Your tracking should include:
- Service-specific terms: Mix broad keywords (“air conditioning”) with specific ones (“Daikin split system installation”).
- Geographic modifiers: Include suburb names (“air conditioning Subiaco”) and “near me” variations.
- Search intent signals: Track question-based keywords (“how much to install air con”) to capture customers at all stages of their search.
This approach helps you gather targeted data that drives meaningful SEO improvements.
Taking Action on Your Grid Insights
Once you’ve identified your weak “red” and “orange” zones, you can take specific actions to improve your visibility there.
Google Business Profile Updates
- Refine Service Areas: In your Google Business Profile, list the specific suburbs where your rankings are weak as part of your service area.
- Answer Questions: Use the Q&A feature on your profile to answer questions that include names of your target suburbs.
- Upload Geo-tagged Photos: Take photos of your work in those specific areas and upload them to your profile. Modern smartphones often geo-tag photos automatically.
Website Content Strategies
- Create Location Pages: Build dedicated landing pages on your website for your top-priority suburbs (e.g., “YourService in SuburbName”). Mention local landmarks and streets.
- Write Local Blog Posts: Write blog posts about projects you’ve completed in those areas or topics of local interest.
- Optimise Meta Descriptions: Update the meta titles and descriptions of your location pages to include the suburb name.
Building Local Authority Signals
- Get Local Backlinks: Sponsor a local sports team or community event in a target suburb in exchange for a link from their website.
- Request Reviews from Specific Areas: Encourage happy customers from your weaker zones to leave a Google review. You can do this by sending a follow-up email with a direct link to your review page. Getting more Google reviews is a powerful signal.
- Ensure NAP Consistency: Make sure your business Name, Address, and Phone number are identical across all online directories. A Whitespark study found that citation inconsistencies are a top negative ranking factor. Keeping them consistent is critical, as detailed in our guide to NAP consistency in local SEO.
Which Geo-Grid Tool Is Best For You? A Quick Comparison
While there are many tools, most Australian businesses will find their needs met by one of these three popular platforms.
| Tool | Best For | Starting Price (Approx.) |
|---|---|---|
| Local Falcon | Detailed, granular tracking with a user-friendly interface. | $25 USD/month |
| BrightLocal | All-in-one local SEO platform with citations and review management included. | $39 USD/month |
| Grid My Business | A free and simple tool for basic, quick checks. | Free |
For most businesses I work with, Local Falcon offers the best balance of power and ease of use. However, BrightLocal is a great option if you want a more comprehensive local marketing suite.
Final Thoughts on Geo-Grid Rank Tracking
Geo-grid rank tracking is essential for any Australian business that relies on local customers. It provides a true, visual representation of your performance on Google Maps and in local search.
It helps you move beyond vanity metrics and make data-driven decisions that actually lead to more customers.
Key Takeaways:
- You can see exactly how your rankings change from one suburb to the next.
- The data shows you where to focus your SEO efforts for the best return.
- It allows you to analyse your local competitors and find opportunities to outperform them.
By regularly monitoring your geo-grid maps and taking targeted action based on the results, you can steadily improve your local visibility, attract more qualified leads, and grow your business.
Frequently Asked Questions (FAQs)
What is the best grid size to use?
For dense urban areas like the Sydney or Melbourne CBD, a 300-500m grid point distance is ideal. For suburban or regional areas, 1-5km is usually sufficient to get a clear picture without unnecessary detail.
How often should I check my geo-grid rankings?
For most local businesses, running a geo-grid scan once or twice a month is enough to track progress and spot trends. If you are in a highly competitive market or have just launched a new marketing campaign, weekly checks can be beneficial.
Why are my rankings high near my business but low everywhere else?
This is very common and is a direct result of Google’s proximity-based ranking algorithm. To improve your rankings further away, you need to build your authority through location-specific content, getting reviews from customers in those areas, and building local backlinks.
Can I track my competitors with these tools?
Yes, most geo-grid tracking tools like Local Falcon and BrightLocal allow you to add your main competitors to the scan. This will show you their ranking heatmap alongside yours, making it easy to see where they are stronger or weaker.
Is geo-grid rank tracking worth the cost?
For any business where local search is a key source of customers, yes. The cost of these tools is minor compared to the potential return from improving your rankings in key service areas and attracting more high-intent customers.
Related Blog Posts

Dorian Menard
https://searchscope.com.auI’m Dorian, founder of Search Scope and an SEO obsessed with ROI and lead generation. After a decade in the trenches, I’ve built and ranked digital assets for businesses across the world. I cut through the noise with data, automation, and strategies that actually convert. When I’m not scaling rankings, you’ll find me on a motorbike or setting chess traps — always planning three moves ahead.